Article Text

Statistics from Altmetric.com
You have a question, or want to find out current perceptions about a subject, and a comprehensive literature search does not give the answer. A questionnaire or survey, if appropriately designed and administered, can be an easy and efficient way to collect data. However, a well-designed tool is essential to provide meaningful answers.
Guidance on good questionnaire design is available.1–4 This can be framed around three simple steps: preparation—evaluation—delivery. Analysis and interpretation are the final stages of completing the research.
Preparation
Is a survey method the most appropriate research tool to answer the question? Questionnaires are useful to investigate opinions or attitudes of a population. If a questionnaire is chosen as the research tool, the next step is to identify whether a validated instrument already exists. If a tool needs to be designed, what format would be of greatest value in answering the enquiry; a structured interview or a self-completed written form? The latter can gather a large amount of rich data, while the former provides a deeper understanding through semistructured questioning.3
Self-completed questionnaires require careful construction with clear articulation of purpose. Their success depends strongly on format as well as the wording; use an attractive, easy to navigate presentation and ensure the length is kept as short as possible. Consider whether to include open or closed questions, or a combination of both. Questions should only include a single point, written unambiguously and contained within short sentences. Wording should be appropriate for your survey population and avoid jargon to reduce potential confusion. Closed questions can provide large amounts of easily handled (often numerical) data. Open questions, as in free text responses and larger interview surveys will collect rich information, but will require considerable resource time for the analysis, including methods for sorting and coding of the data.
Sampling
How much data are needed to answer the question? The intention is that results from a ‘sample’ can be generalised back to the whole population. Sampling within the whole population, or subgroup, may be the most manageable way to answer the research question as the amount of data gathered from a census would be overwhelming. Recruitment can be by advertising, although selection should include random participation to reduce investigator bias; response bias cannot always be avoided.5 If a subgroup (eg, ethnic, geographic, socioeconomic) is the subject of study, then participant selection needs to be targeted, systematic and consistent. Despite this general ‘rule’ of random selection, there is a place for opportunistic or convenience sampling (eg, finding participants from among your colleagues or those attending a meeting or lecture), provided the potential limitations are articulated. Identifying appropriate sample size can be facilitated using freely available on-line sample-size calculators. The smaller the population being studied, the greater the proportion of this population the sample should be. And however the sampling is done, it is essential the limitations this places on data interpretation are understood. This is particularly true for convenience sampling when participants may hold very similar opinions and thus not truly reflect the study population.
Response formats and scales
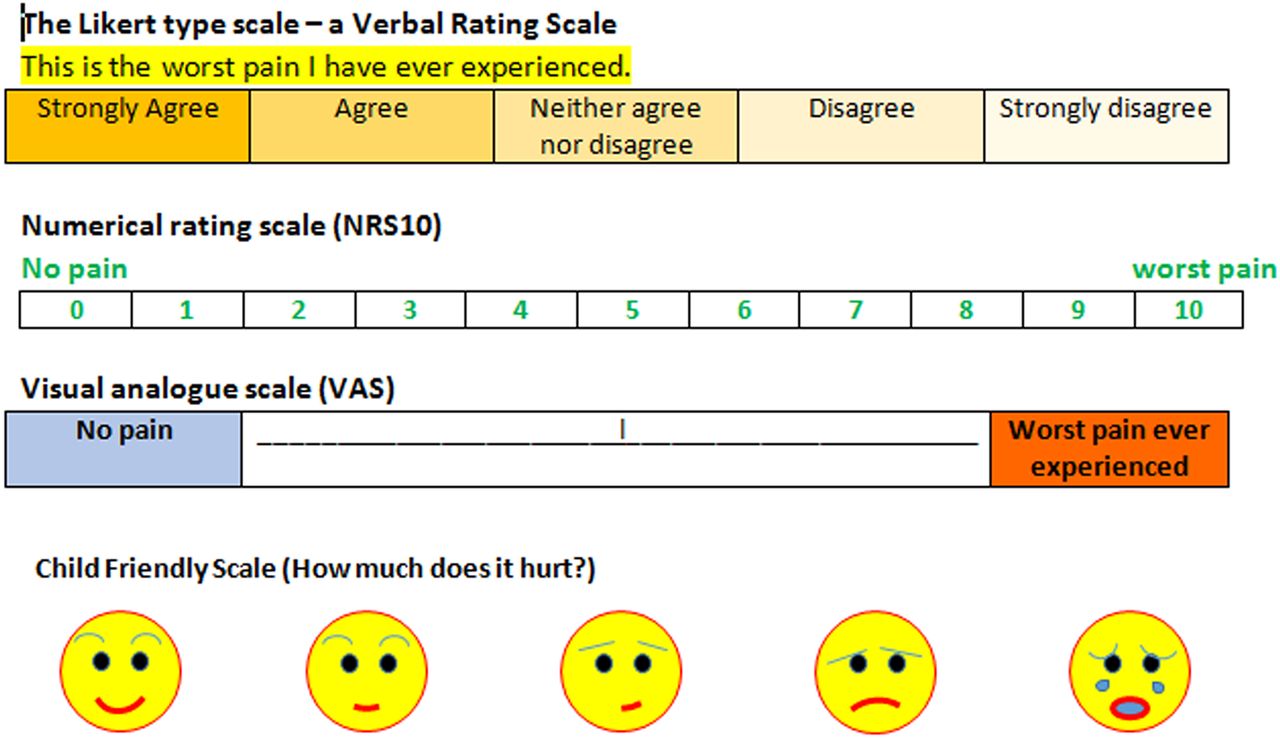
Many formats may be used as illustrated in figure 1, the most common being the Likert or modified Likert. Additionally, simple binary decisions (yes/no) or items with multiple choice options can be very useful. The scale choice should be designed to contribute positively to data collection. Confusion within questionnaires arises when combining or changing formats; these should be well signposted to ensure participants continue to respond appropriately.6 Including some free text items is valuable in exploring context, broadening the scope of answers and providing rich data to enhance numerical result interpretation.

For the Likert-type scales, the question becomes a statement that can be agreed or disagreed with. Where subjects are to choose a position on a line or within a number range, the ends of the scale must be explained and a clear set of statements or anchors used. There is often a neutral point shown here as neither agree nor disagree, the number 5 and the vertical line on the Visual Analogue Scale (VAS). Face-Pain Scales are useful for young children to indicate severity, with the assisting adult describing pain levels (“this one hurts a lot and you want to cry”).
Evaluation
Field testing a new instrument is essential to evaluate whether it will provide the information needed for the study, and that final versions will elicit reliable and valid responses. Questionnaire evaluators should include researchers, stakeholders and respondents. A clear brief should cover purpose, clarity and layout, and whether items are likely to be well understood in a similar fashion by all respondents. Acceptability and feasibility are important considerations and should include both questionnaire size and length of time required for completion; these should not exceed the participants’ patience threshold. Negative influences of length on response rates and quality are frequently seen in the latter portions of lengthy questionnaires.7 Students are particularly prone to ‘survey fatigue’ from frequent in-course evaluations.
Delivery
Even though questionnaires can easily be kept anonymous, ethical approval is necessary, especially if publication is desired. Consent may be considered implicit through return of a completed form, and an opening statement or a covering letter can make this explicit. Questionnaire distribution should be tailored to the study population to enhance return rate. Postal paper questionnaires or relying on opportunist encounters can be useful. Electronic means can reach large numbers of potential respondents and thus create a large data set. When using email, make sure the ‘bcc’ and not the main or cc addressee lines are used to maintain confidentiality. Accompanying material, attached or accessed via a web link, provides valuable insight into the importance of the research and thus enhances participant interest and completion rate. Consideration of when would be the best time to undertake the survey will depend on the population sampled. For example, avoiding exam time for students or distributing questionnaires to a ‘captive’ audience during lectures is opportunistically useful. Small rewards are often used for surveys, such as entry into a ‘lottery’ or the gift of a chocolate bar, and enhance return rate. However, this can be considered ethically challenging, especially if the inducements are considered likely to significantly influence compliance and should be discussed within ethical approval processes.
Analysis and interpretation
The chosen questionnaire format should include consideration of how the data will be processed. The availability of scannable forms or web forms such as ‘Survey Monkey’ or ‘Typeform’ provides automatic collation, data management and often some statistical analyses. When presenting results, provide comprehensive information on design methodology to facilitate a critical review of outcomes. Condensing data to provide only the central tendencies, that is, means/medians may hide extremes of opinion, thus an indication of range or SD should be included. Connections between items or groups of items from the questionnaire may be important, and factor analysis can demonstrate these and provide tool validity assessments. Graphical representations provide valuable visual overviews of complex data.
Analysis of qualitative (free text) data requires coding (or sorting) data into themes, which will form the basis of an interpretive discussion. There are helpful programmes that aid sorting (theming) of data (eg, NVivo) but any systematic means of sorting comments into themes can be used; cards with quotes written on them are particularly useful for finding themes. Qualitative data may also be presented graphically (eg, flowcharts) and demonstrate data through a density analysis. Remember that a single comment is as valuable in understanding an issue and can be as powerful as a commonly held belief.
Summary
Preparation, evaluation and delivery of a survey instrument are crucial. This includes well-researched background material to confirm the question, ethics approval, a consideration of validity and whether findings might be generalisable. Surveys gather quantifiable data efficiently, but contextual richness and interpretation often come through the free text. Quotes can usefully illustrate your interpretations and conclusions when presenting results (table 1).
The do's (the good) and don'ts (the pitfalls) of questionnaire design
Footnotes
Contributors Both authors have contributed equally to this paper. DTB completed the first draft; both authors have worked together on the subsequent and final versions.
Competing interests None declared.
Provenance and peer review Not commissioned; externally peer reviewed.