Article Text

Abstract
Embedding electronic growth charts (EGCs) into clinical practice in a children’s hospital. We employed initial implementation in the outpatient setting and subsequently extended this across inpatients with the growth chart following the child’s records through both settings and significantly increasing growth data documentation.
- growth
- nutrition
- growth chart
Statistics from Altmetric.com
The problem
Accurate evaluation of growth is a key assessment of child health. Use of a paper growth chart is a standard practice in the UK; however, these charts present a number of problems including inaccurate plotting of measurements, variable availability, difficulty plotting serial points on one chart and the chart may simply be lost. If the paper growth chart is not available, a new chart is frequently started; thus, growth measurements are not held in one place. Furthermore, if a child is reviewed by multiple specialties and there are separate notes kept by an individual clinical service, growth data will not be shared. Growth data should be collected opportunistically, accurately, located on one chart, available to all caring for the child and easily accessible and simple to plot. Across medical, surgical and specialty children’s outpatients we have previously found that overall only 33% of children had a height and weight documented at their outpatient visit on a paper growth chart when attending outpatients.1 Our trust had a drive to become paper light, so there needed to be a way to store growth data electronically.
Aims
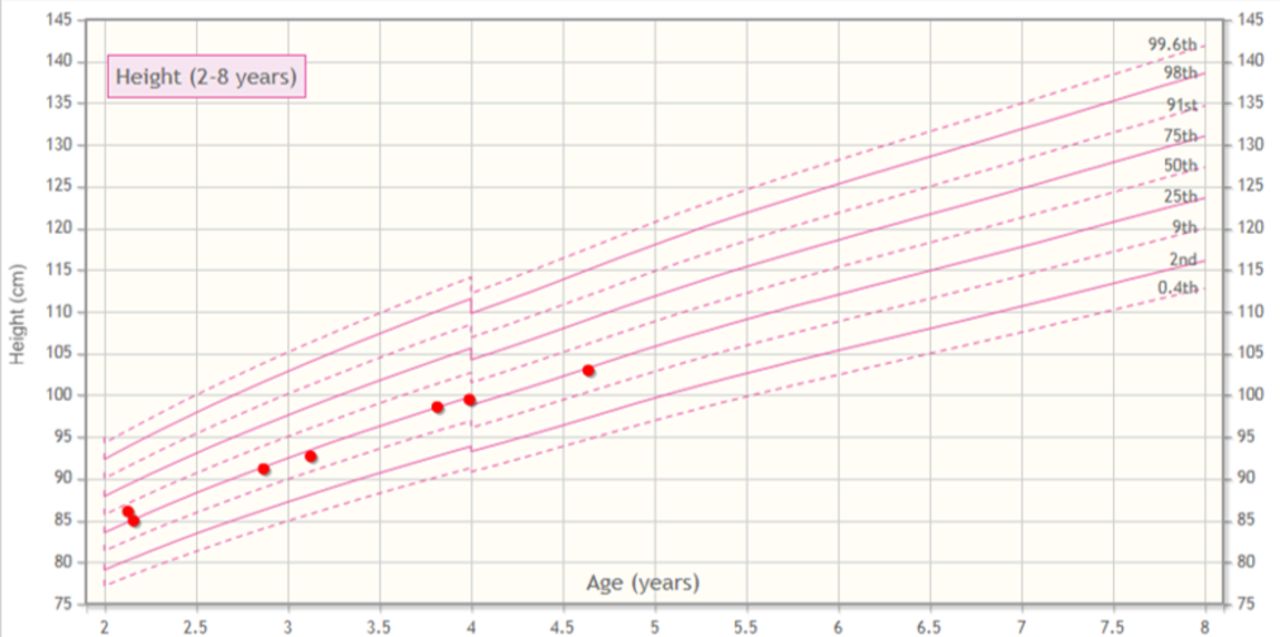
We aimed to generate electronic growth charts (EGCs) for every child managed at our trust. The growth charts were to be developed from the same growth data as that used by the Royal College of Paediatrics and Child Health growth charts and embedded with the patient’s electronic patient record.2 3 Functionality to be developed included, automatic plotting of height, weight, head circumference and body mass index (BMI) (with BMI plotted on a chart showing absolute BMI as well as the BMI centile lines), ability to annotate or correct the chart and plotting of a target centile range (figures 1–3). Additionally, a separate growth calculator was included which calculated the height SD score (SDS), weight SDS, target height SDS, birth weight SDS and height velocity.

Electronic growth charts with height data displayed.

Electronic growth charts with weight data displayed.

Electronic growth charts with BMI data displayed.
Making a case for change
As the trust’s objective was to become paper light, EGCs presented a solution as well addressing the disadvantages of paper charts. The concept was presented to the department of child health and there was agreement for their development. A business case was made with the trust IT team and funding agreed. A working group was composed of a clinician, trust IT personnel, a university statistician and a representative from a software company with the proposal being developed in phases.
Your improvements
EGCs were initially trialled in children’s outpatients to establish usability and practicality prior to implementation as an inpatient system. Staff co-design was utilised in the design phase to ensure a system that was usable by different professional groups as well as workability from IT. The EGCs are now embedded in the same trust software used to access results, letters and request investigations, thus are available at all times. When biometrics are entered they appear as a red dot on the EGC, the date of data entry and numerical value will also show. Birth weight and target height range are also displayed. The EGC will correct for gestational age and generate a height velocity. EGCs are also printable and can be given to parents or included in transfer letters. The EGCs developed differs from others as they are available both for inpatient and outpatient settings, staff are also able to access and plot them across various IT programmes with the growth chart following the patient electronically.
Since the introduction of EGCs, a review of attendances to our children’s outpatients (medical, surgical and specialties) demonstrated that overall 77% (48/62) of children had both height and weight plotted on the EGCs with many specialties now achieving 100% documentation.
Learning and next steps
One of the key steps to make this a successful solution was integrating the EGCs with the existing trust software used by clinicians and making data entry and accurate plotting of measurements quicker than using paper charts. Data collected and displayed here from a user survey of 27 staff demonstrates that the EGC is viewed as easier to use, plots more clearly and easily and is more accessible than paper charts (figures 4 and 5). The next step is to develop specific EGCs for Turner’s syndrome and trisomy 21. The EGCs also retain the same visual identity and importantly use the same optimal growth descriptions of healthy breastfed children as the UK-WHO growth charts. The easy usability of EGCs has been a key foundation in sustaining their use as well as their accuracy and the clarity of presentation of growth data. As the trust continues its drive to become paper light it will be important that EGCs remain integrated with the IT software.
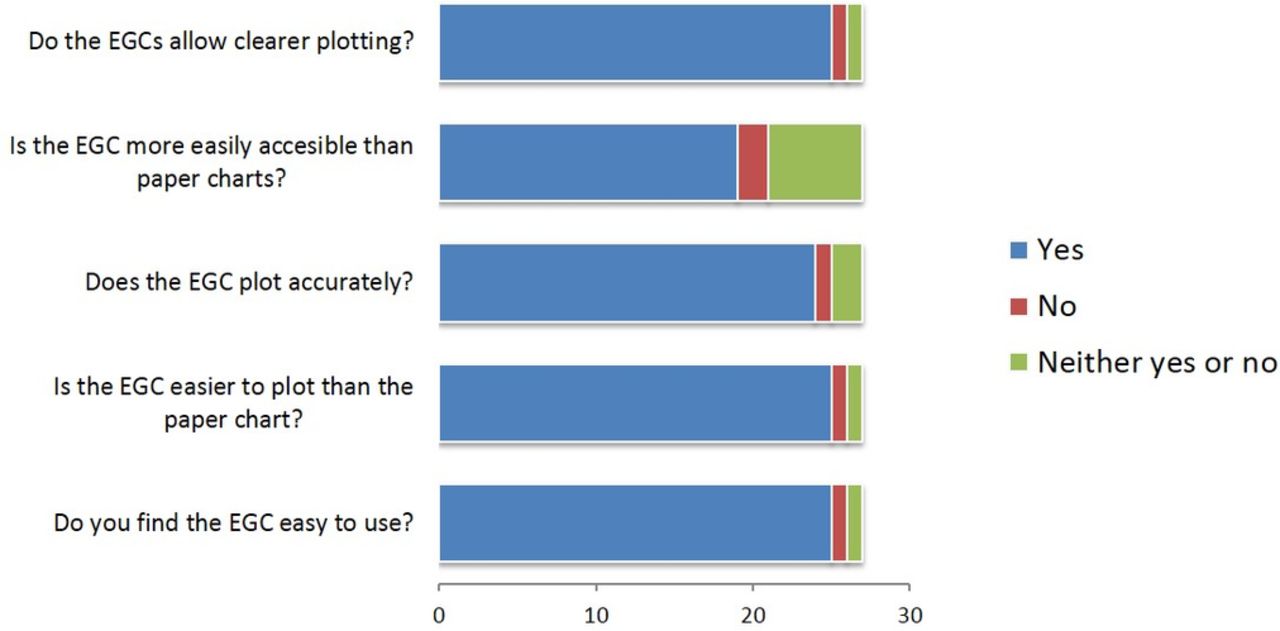
Staff survey responses. EGC, electronic growth charts.

Job roles of staff survey responders.
References
Footnotes
Contributors The article was written and edited by ETA and JHD. Data collection was undertaken by ETA and HM. SW, DC, JHD and AM were involved in the design of the electronic growth charts.
Competing interests None declared.
Provenance and peer review Not commissioned; externally peer reviewed.