Article Text

Abstract
Background Bed capacity management is a critical issue facing hospital administrators, and inefficient discharges impact patient flow throughout the hospital. National recommendations include a focus on providing care that is timely and efficient, but a lack of standardised discharge criteria at our institution contributed to unpredictable discharge timing and lengthy delays. Our objective was to increase the percentage of Hospital Medicine patients discharged within 2 h of meeting criteria from 42% to 80%.
Methods A multidisciplinary team collaborated to develop medically appropriate discharge criteria for 11 common inpatient diagnoses. Discharge criteria were embedded into electronic medical record (EMR) order sets at admission and could be modified throughout a patient's stay. Nurses placed an EMR time-stamp to signal when patients met all discharge goals. Strategies to improve discharge timeliness emphasised completion of discharge tasks prior to meeting criteria. Interventions focused on buy-in from key team members, pharmacy process redesign, subspecialty consult timeliness and feedback to frontline staff. A P statistical process control chart assessed the impact of interventions over time. Length of stay (LOS) and readmission rates before and after implementation of process measures were compared using the Wilcoxon rank-sum test.
Results The percentage of patients discharged within 2 h significantly improved from 42% to 80% within 18 months. Patients studied had a decrease in median overall LOS (from 1.56 to 1.44 days; p=0.01), without an increase in readmission rates (4.60% to 4.21%; p=0.24). The 12-month rolling average census for the study units increased from 36.4 to 42.9, representing an 18% increase in occupancy.
Conclusions Through standardising discharge goals and implementation of high-reliability interventions, we reduced LOS without increasing readmission rates.
- Hospital Medicine
- Paediatrics
- Communication
- Healthcare Quality Improvement
- Teamwork
Statistics from Altmetric.com
Introduction
A 2001 Institute of Medicine report1 urged a redesign of the American healthcare system to provide safer, quality care. Improvement aims included providing care that is timely, by ‘reducing waits and sometimes harmful delays,’ and efficient, by ‘avoiding waste.’ In 2003, the Institute for Healthcare Improvement (IHI) released a report2 to address these aims. The authors proposed real-time demand capacity management that includes predicting and matching available beds (capacity) and the number of patients waiting (demand), using predictions to improve planning, and uncovering the reasons for failures to identify and eliminate recurring barriers. They also suggested that healthcare systems reduce variation to improve flow.
A recent study by Srivastava et al found that nearly one in four patients in a tertiary care children's hospital experienced a medically unnecessary prolonged hospital stay of at least one day.3 The mean delay was 2.1 days, representing 9% of paediatric hospital days and 8.9% of total costs. The authors conclude that future interventions to decrease length of stay (LOS) need to focus on addressing variation in physician criteria for discharge, as the most common delay was related to physician variability in clinical decision-making. While several studies include standardisation of discharge processes to improve flow,4–7 they do not directly address the use of standardised medical criteria to determine discharge timing.
Inefficient discharges impact flow throughout the hospital. While some hospitals have set a discharge time goal similar to a hotel checkout such as 11:00, a recent editorial by Iantorno and Fieldston warned against such an approach.8 They noted that the unique needs of patients can make an arbitrary time goal inappropriate and impractical and could result in unintended consequences. Instead, they recommended assessing high-quality discharge by integrating process, outcome and balancing measures, including patient satisfaction and readmission rates.
In 2008, concerns regarding the impact of discharge delays on flow and bed availability inspired the design of a project at our centre, Cincinnati Children's Hospital Medical Center (CCHMC), to predict the timing of discharges. The goals of the discharge prediction initiative were to anticipate bed availability for future admissions and transfers, place patients on the appropriately-skilled nursing floor based on their diagnosis, and match nurse staffing to patient census. The predicted discharges took into account a variety of medical, social and system-level factors that determine discharge readiness, such as available transportation and medications ready at the pharmacy. By 2010, our predictions had improved. However, delays in discharge persisted, leading to waste, inefficiency, and the potential for delayed admissions and delayed or cancelled surgeries. This initial discharge prediction work created a framework for a new process intended to discharge patients based on medical readiness, regardless of the time of day patients reach their goals.
This article describes the use of improvement methods9 and reliability science10 to develop and implement a sustained process to standardise discharge criteria and combine them with proactive planning to reduce discharge delays. The Hospital Medicine (HM) service accounts for a third of all hospital admissions at CCHMC making this service an ideal population on which to test this new process. Our specific aim was to increase the percentage of HM patients with one of 11 common inpatient diagnoses discharged within 2 h of meeting medically-ready criteria from 42% to 80%.
Methods
Setting
CCHMC is a large, urban paediatric academic medical centre that uses an electronic medical record (EMR) for all inpatients. In fiscal year 2012, CCHMC had 7121 inpatient general paediatric admissions to the HM service, of which approximately 58% were patients admitted with one of the 11 study diagnoses. The majority of HM patients are admitted to one of two 24-bed units at the main campus or a 12-bed satellite campus. Patient care at the main hospital is provided by HM fellows, paediatric and family practice residents, and medical students who are supervised by paediatric hospitalists or community-based paediatricians. At the satellite campus, care is provided by HM attending physicians only. This quality improvement initiative took place on all three HM inpatient units.
Human subjects protection
This study was reviewed by the CCHMC institutional review board and deemed exempt systems improvement.
Planning the intervention
A multidisciplinary team, consisting of bedside nurses, paediatric residents and chief residents, nursing leaders from both campuses, quality improvement experts, a data analyst, the parent of a patient, and HM attending physicians, mapped the inpatient process,11 conducted a failure mode and effects analysis,12 and examined the key drivers that prioritised interventions (figure 1).

Key driver diagram.
The team collaborated to develop medically-ready discharge criteria, based on available evidence and expert consensus, for 11 common inpatient diagnoses (see online supplementary file A). The criteria were diagnosis-specific goals (eg, stable without supplemental oxygen for 6 h for patients with bronchiolitis) and did not include system issues (eg, transportation available). The discharge criteria for all 11 targeted diagnoses were embedded in EMR admission order sets (see online supplementary file B). Physicians could modify the criteria as a patients’ clinical course evolved during their hospital stay. Nurses were expected to monitor patient status and place an EMR time-stamp to signal when patients met all discharge goals. If a patient did not leave within 2 hours of meeting discharge goals, nurses documented the reason for delay.
Improvement activities
Interventions focused on the three key drivers: (1) key stakeholder buy-in and shared ownership; (2) discharge barriers defined and mitigation plans established; and (3) transparency of team performance with attentive preoccupation with failures. Changes were tested through a series of plan-do-study-act cycles.9 Strategies were initially piloted for six diagnoses on two units; the remaining five diagnoses were added in the second year with spread to a third unit. The pilot diagnoses were chosen because they were our top admitting diagnoses, making them good starting points for rapid cycle learning. Asthma was the top diagnosis associated with discharge delays. There was also a high degree of consensus regarding discharge criteria for these diagnoses among the attending physicians, leading to increased buy-in at the start of the project. All six pilot diagnoses had previously-created admission order sets in which to embed the discharge criteria. The process for improvement used proactive discharge planning based on the common failure reasons for patients staying beyond 2 h: medication, consults and physician delays.
Key stakeholder buy-in and shared ownership, with clarification of roles and responsibilities
Standardisation of discharge criteria among attending physicians: Prior to this project, individual attending physicians had varying discharge criteria preferences. For example, for a patient admitted with bronchiolitis, some attending physicians discharged the patient after the patient was stable on room air for 4 h while others waited until they were stable for 6 or 12 h. These criteria were often not communicated to nurses, residents or families, making proactive planning difficult and leading to inefficient discharges. To decrease this clinical practice variation, we used an online survey and group discussion to obtain attending physicians’ consensus on discharge criteria for common diagnoses. Throughout the study, the team emphasised the modifiable nature of the criteria, reassuring the attending physicians that they would retain autonomy in adjusting the criteria to match individual patient’s needs.
Inclusion of discharge criteria in EMR order sets: Since the criteria were embedded into the physician EMR admission order sets, documentation of criteria was easily incorporated into physicians’ workflow. Nurse and physician leaders asked that the goals, viewable by the entire medical team, be discussed daily during family-centred rounds,13 allowing physicians, nurses and families to collaborate over modifications to the goals (see online supplementary file C). Because nurses and physicians were able to see in the EMR the exact time a patient met his/her discharge criteria, they could prioritise early rounding on patients ready for discharge and identify and mitigate14 any potential failures prior to the 2 h time limit.
Inclusion of resident physician discharge tasks: As the majority of our patients are managed by resident physicians, several interventions focused on education regarding the importance of efficient discharges. A conference introduced the discharge criteria to the residents and instructed them on their responsibility to enter discharge criteria orders at patient admission. Emphasis was placed on the proactive completion of discharge tasks prior to patients reaching these goals. Each month, the chief residents also sent an introductory email about the project to the entire team and discussed resident expectations at team meetings. A criteria reminder sheet was posted in resident team workrooms and on the nursing units. A quality improvement poster created by the chief residents and updated each quarter highlighted this project as a strategic initiative and one of the four high-priority projects on which the residents were expected to focus efforts.
Leverage of nursing performance management system: Performance management is a pay-for-performance managerial system used at CCHMC to plan, evaluate and reward individual employee performance. Annually, all inpatient units set measureable goals that align with institutional strategic priorities. To receive the associated financial incentive or annual merit increase tied to the goal, the entire nursing unit must achieve the goal. To obtain buy-in from the nursing staff, in October 2011, the discharge outcome measure was included as one unit's performance management goal as a motivational strategy.15 The goal set by unit leadership was discussed and reviewed at annual evaluations and each nurse was held accountable for meeting it. In 2012, the other two units added the discharge outcome measure as their annual goal.
Discharge barriers defined and mitigation plans established
Outpatient pharmacy redesign: Baseline analysis of failures revealed that pharmacy delay in filling outpatient prescriptions was the most frequent reason for patients not leaving the hospital within 2 h of meeting discharge goals (see online supplementary file D). Pharmacy delays included inaccurate or missing prescription insurance information, lengthy prescription filling, inadequate pharmacy notification that the prescriptions were ready for pick-up, and delays in families picking up their medications. To address these issues, nurses documented families’ preferred pharmacies in the EMR at patient admission. If the CCHMC outpatient pharmacy was chosen, the prescription insurance information was faxed to the pharmacy by the health unit coordinator for immediate entry into the pharmacy system. To allow priority filling of prescriptions for inpatients, pharmacists referenced a new report generated from the existing discharge prediction system each morning and filled prescriptions for anticipated early morning discharges first. Pharmacy staff also began paging the charge nurse when prescriptions were ready for pick-up or if additional information, such as prior authorisation, was needed. Beginning in January 2013, during weekday business hours, a pharmacy technician was assigned to deliver filled prescriptions to the patient's bedside. Throughout the project, physicians were encouraged to fax the medications to the CCHMC pharmacy as early in the admission process as possible.
Subspecialty consult timeliness: Many patients admitted with asthma exacerbations receive an asthma team consultation (staffed by physicians who specialise in pulmonary medicine or allergy/immunology) for medication adjustment, diagnostic testing recommendations and outpatient follow-up. Initial failure analysis revealed that waiting for the asthma team's recommendations often delayed discharges for these patients. In January 2012, a pulmonologist led a project to improve the timeliness of asthma team consultations. Interventions included prioritising consultations based on predicted discharge time and instituting a brief consultation note with asthma team recommendations to facilitate timely filling of prescriptions.
Transparency of team performance with preoccupation with failures
Throughout the study, daily failure data were generated from the EMR and emailed to improvement team members, enabling them to focus on near real-time feedback of data to create a highly-reliable and visible system. The reports included automated patient-specific data, including name, medical record number, unit and resident team, so that process owners could identify and mitigate14 missing medically-ready discharge orders and EMR time-stamps to prevent process failures. This transparency of data gave the improvement team the opportunity to provide individual feedback to residents and nurses about outcome failures. The daily review of failure data allowed unit leaders to learn from failures, identify knowledge gaps and ensure accountability with the frontline staff. Subsequently, run and control charts16 ,17 depicting the process and outcome measures,18 both at the individual-unit-level and for overall HM compliance, were shared weekly with key stakeholders and bedside providers.
Information was provided and reviewed at all levels (nursing unit, resident and attending physician). Starting in August 2012, a large colour-coded scorecard posted in the resident conference room displayed the team-specific and overall results for the five resident teams. Each week, the control chart and team performance were emailed to the attending physicians. The run charts were also posted on the units and discussed at monthly staff meetings.
Planning study of the intervention
Data were collected from July 2011 through April 2013. Data were initially collected on paper and later via the EMR. Patients with one of the 11 study diagnoses were identified by admission diagnosis code extracted from the EMR. Project measures were established to include an analysis of process, outcome and balancing measures19 to ensure that more timely discharge was not negatively impacting readmission rate or patient/family satisfaction. Balancing measures compared eligible patients during the study period to the year prior to beginning the project to reduce the effects of seasonality. The measures, as outlined and defined in table 1, were evaluated throughout the project.
Key project measures
Analysis
Primary analysis of both process and outcome measures was performed using run and statistical process control charts.16 ,17 Median and mean LOS and readmission rates before and after implementation of process measures were compared using the Wilcoxon rank-sum test and t tests, with consideration of equality of variance for each diagnosis.
Results
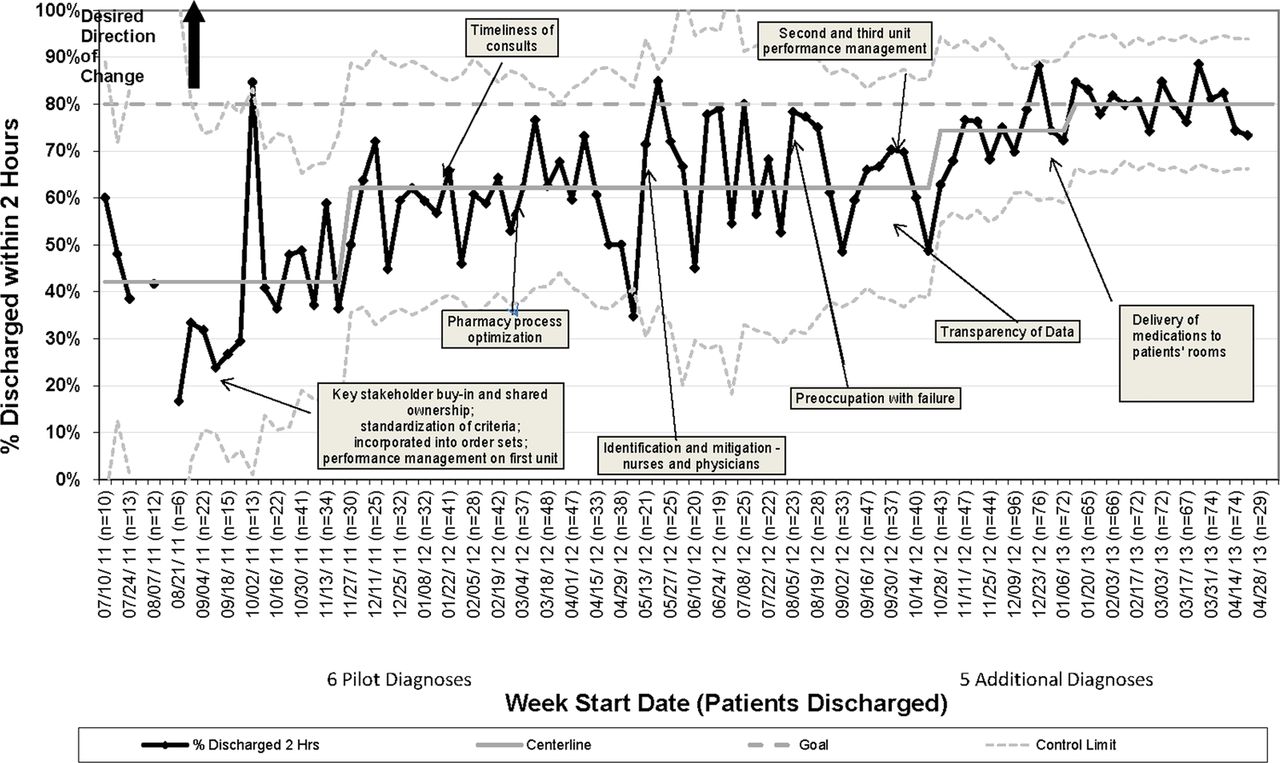
The physician process measure, the percentage of patients who had discharge orders written, increased from 70% to 90% within 7 months of starting the project (figure 2). The nurse process measure, the percentage of eligible patients who had the EMR time-stamp when all discharge criteria were met, improved from 46% to 82% in 9 months (figure 2). The percentage of HM patients with one of the 11 selected diagnoses who were discharged within 2 h of meeting discharge goals increased from 42% to 80% within 18 months and has been sustained for 4 months (figure 3). In addition, variation was decreased, confirming the stabilisation of the process over time. Separate run charts for the two units at the main campus are provided in online supplementary files E1 and E2.
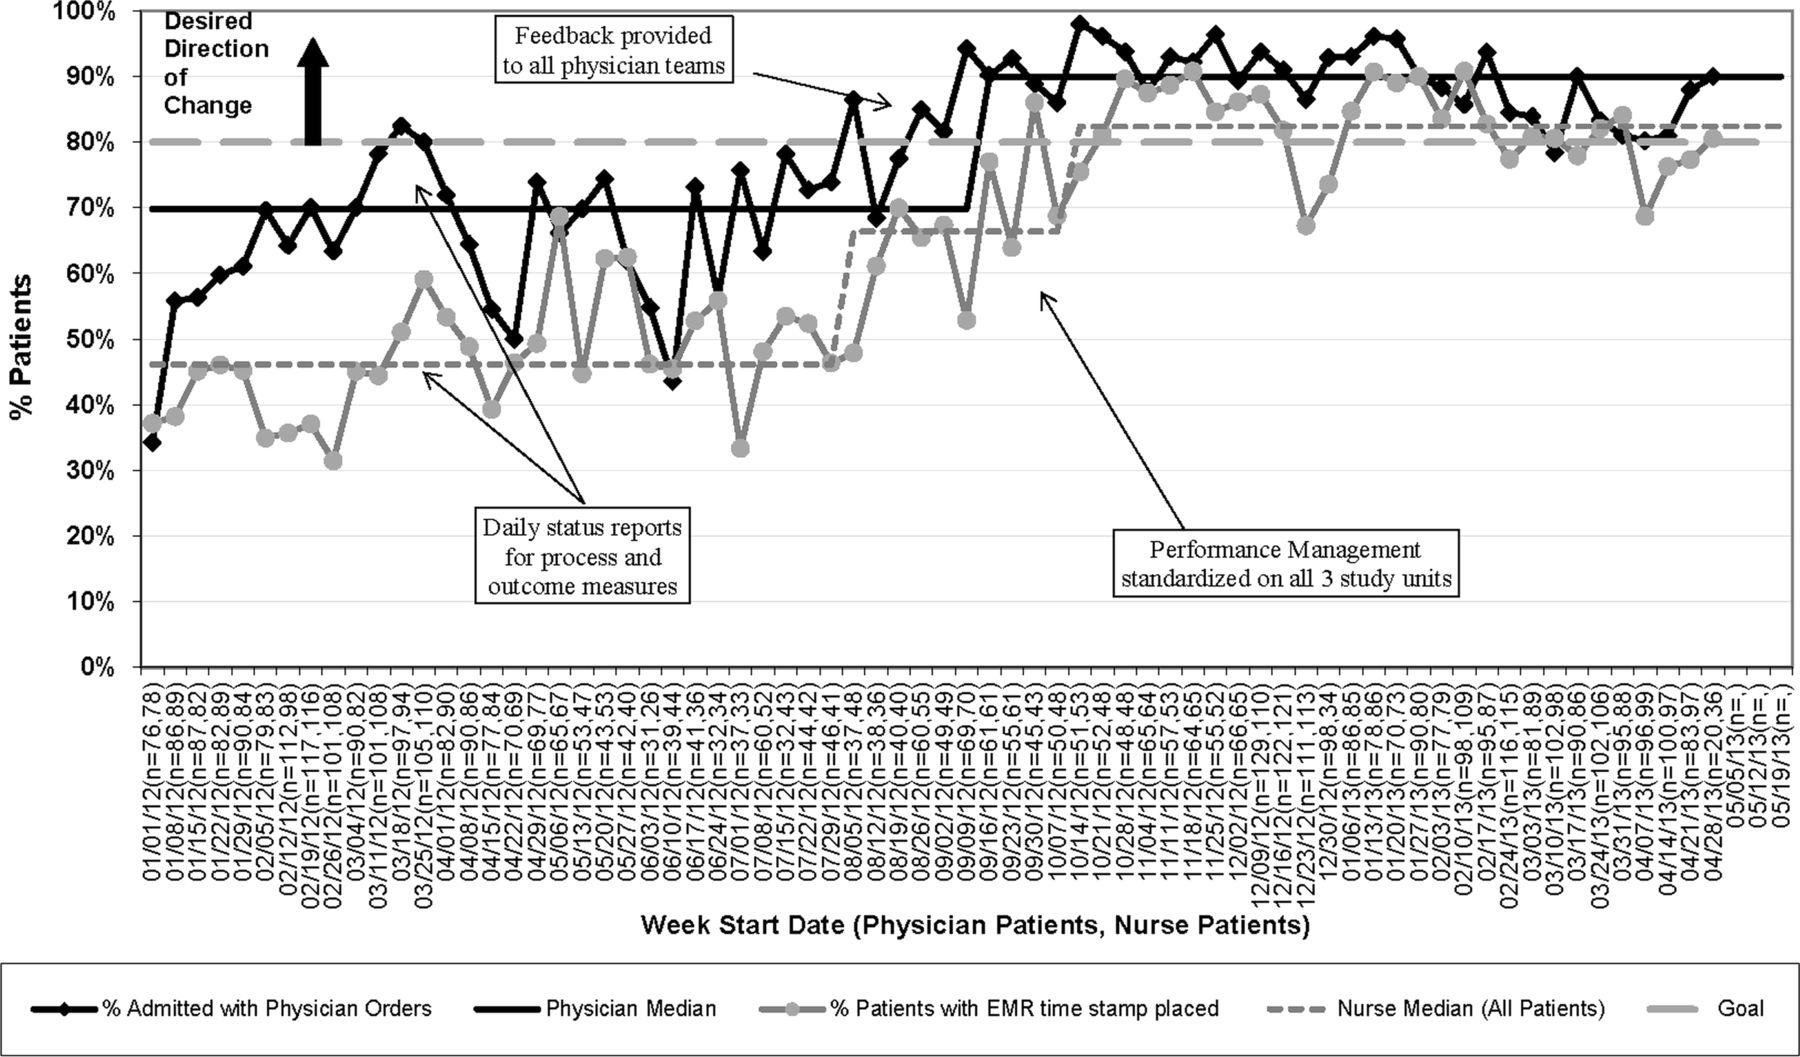
Process measure for physician discharge criteria order entry and nurse compliance with documenting in the electronic medical record the time the patient met discharge criteria.

Control chart for percentage of patients discharged within 2 h of meeting discharge criteria.
Initial improvement coincided with the 2011 introduction of the performance management goal on one of the units (Unit A), increasing the percentage of patients discharged within 2 h from 39% to 61% on this unit. When the goal was spread to the other 24-bed unit, we saw a similar unit improvement, from 49% to 69% (Unit B). This intervention was associated with the largest improvement in the percentage of patients discharged within 2 h of meeting their goals.
Median LOS for patients admitted with one of the 11 study diagnoses who were included in the study decreased from 1.56 to 1.44 days (p=0.01) when compared with the same time period before the study (July 2010–April 2011; table 2). When analysed individually, asthma, representing 42% of the study population, was the only admission diagnosis that showed a statistically significant improvement in LOS. When patients admitted with asthma were excluded from the analysis, there still was a statistically significant decrease in median LOS for the remaining diagnoses (1.74 vs 1.66 days, p=0.01). This improvement occurred during a period of overall increased demand for resources (beds and staffing). Using a 12-month rolling average to account for seasonality, the average daily census increased by 18% from a prestudy average of 36.4 to an average of 42.9 at the end of the study. Readmission rates remained similar for individual diagnoses and overall (4.60%–4.21%, p=0.24).
Length of stay (LOS) and readmission rates
Following implementation of the interventions, issues related to transportation and parent/patient factors were the most common reasons for on-time discharge failures, rather than internally controlled delays like medications and consultations (see online supplementary file D). On all three inpatient units, the overall family satisfaction with the hospital stay remained unchanged during the study, as measured by the CCHMC satisfaction survey question (table 1). Specifically, the median percentage of patients rating the hospital at the highest level of 10 remained 60% for two of the units and 58% for the third unit.
Discussion
We used improvement science and reliability methods to implement a successful process for discharge efficiency for 11 paediatric diagnoses while also shortening LOS. As a result, hospital beds were available for unplanned admissions and postsurgical care. Our process did not increase readmissions or reduce patient/family satisfaction. Following the failure mode and effects analysis, improvement activities focused on the key drivers to successful and sustained discharge efficiency: key stakeholder buy-in and shared ownership, discharge barriers defined and mitigation plans established, and transparency of team performance with preoccupation with failures.
In response to the IHI suggestion to decrease variation to improve flow2 and the results of Srivastava and colleagues demonstrating that physician variability in clinical decision-making was the most common reason for discharge delay,3 a critical first step was to standardise the discharge criteria. While there have been some reports of condition-specific (eg, heart failure) and age-specific (eg, elderly patients) discharge checklists,20–23 we believe our report is the first to describe the development and implementation of standardised discharge criteria for common paediatric conditions.
The team defined the primary outcome measure as the percentage of patients discharged within 2 h of meeting discharge criteria. Our goal was set at 80% as we realised that it would not be feasible for a subset of patients with extenuating circumstances, such as those admitted for social concerns or awaiting foster home placement, to be safely discharged within 2 h of being medically-ready. Initial analysis during the first 6 months of data collection showed that this goal was attainable, as only 10.4% of the failures were outside of the team's control (eg, parent transportation issues). The 2 h window between meeting discharge goals and leaving the hospital bed allowed adequate time for final preparation, family packing and transport off of the unit. Subsequent analysis of other time windows (1 h, 3 h, 4 h) indicated that 2 h provided an aggressive, yet realistic, target. Shorter windows resulted in a large increase in failures, while longer windows only slightly improved the results, as roughly half of the failures were related to patient/family controlled issues, such as transportation.
After implementing the process with our initial 11 diagnoses, frontline nurses and residents voiced concerns about the difficulty of reliably embedding the processes into their daily workflow. Since the process initially only applied to half of the HM patients, it was challenging to remember which patients needed discharge criteria ordered and an EMR time-stamp. Thus, we focused on taking advantage of habits and patterns by applying the improvement processes to all HM patients. Though we only collected data on patients with the 11 study diagnoses, residents and nurses were encouraged to follow the same process for all patients, using a checklist of general, customisable criteria embedded into a general order set. By shifting from a work-by-exclusion model to a model inclusive of all patients, these tasks were better integrated into frontline provider workflows and our outcome measure improved. The nurses, in particular, requested the process be expanded to all patients. Even though the discharge criteria were embedded in the chart in daily notes, the orders provided nurses with an easily-found, shared mental model of the goals for discharge. For example, if a nurse was not present for family-centred rounds, she/he could still be up to date on the plan of care. This allowed nurses to proactively plan for discharge and prioritise their workload based on discharge planning needs.
By incorporating standardised discharge criteria into the plan of care, the project not only reduced the overall median LOS, but did so without increasing hospital readmissions, a potential sentinel event for an ineffective or hurried discharge. Our study conclusions complement those by Morse et al24 that children's hospitals with decreased LOS did not have associated higher readmission rates. Our changes were incorporated over a time period when the average daily census within the study units increased by 18%, with no increase in admission or transfer delays for these units.
Asthma, accounting for 42% of the study population, was the only individual diagnosis associated with a significant decrease in LOS. Evidenced-based policies at CCHMC recommend that patients admitted with the diagnosis of asthma fill their prescriptions prior to discharge. Often, the choice of discharge medications is decided in collaboration with our asthma team consultants. As the most common diagnosis in our study and the one most associated with discharge delays, we were able to quickly identify asthma discharge delays and direct our interventions towards them. Due to the discharge requirements for asthma, not surprisingly, delays in receiving consultations and medications were the most common reasons for failing to meet the discharge goal.
Although interventions such as the pharmacy process optimisation and consultation timeliness may have disproportionally benefited patients admitted with asthma, they were implemented for all patients. Even after excluding patients admitted with asthma, we still detected a significant decrease in LOS for the remaining diagnoses. Further interventions, targeted at other specific populations (eg, improved suctioning frequency and reduced use of continuous pulse oximetry in bronchiolitis), are currently being tested.
CCHMC values improvement science as an integral part of residency training. However, the residents can sometimes become overwhelmed by competing quality improvement initiatives. The project-specific introductory emails and team meetings at the start of each month were part of the resident culture at our medical centre prior to our project, and we leveraged them to spread our aims to the resident population. Due to the training process provided to the resident teams at the start of the month-long rotation, the mechanisation of the discharge criteria through integration into the EMR, and the identify and mitigate14 process that we established through the daily reports, there were not any noticeable differences in performance as new residents participated in the project each month.
Multidisciplinary collaboration was essential to the success of our project. Because efficiently discharging a patient involves the whole team, communication among team members, including the family, regarding progress towards discharge was important to facilitate proactive planning.
Limitations
Due to limited evidence in the literature, the discharge criteria were developed based on expert consensus. Standardising the criteria, however, was an important starting point to decrease HM attending physician variation and improve communication regarding discharge criteria among physicians, nurses and families.
We are unsure how frequently the criteria ordered on admission were modified by the physicians throughout a patient's stay. We were also unable to verify that social reasons were not included as part of the medically-ready criteria, subsequently delaying the placement of the EMR time-stamp and leading to an inaccurate improvement in our outcome measure. However, our decreased LOS argues against this possibility. We are currently standardising the process of reviewing discharge orders during daily family-centred rounds13 to ensure accuracy and inclusion of only medical criteria. Second, we may not have correctly identified all eligible patients if the admitting diagnosis was not correctly recorded in the EMR or if the diagnoses changed as the patient's disease process evolved.
Both relying on nurses to collect data during their clinical shift and the nursing financial incentive may have affected the accuracy of our outcome measure. Because the nurses were often busy with patient care, the EMR time-stamp may not have been placed at the exact moment the patient met the discharge criteria. To improve accuracy, if the nurses were unable to enter the time-stamp in real-time, they had the option of typing in the correct time. The incentive-based performance management goal may have influenced the accuracy of the outcome measure, given its association with the nursing annual merit increase. Our overall decreased LOS argues against either of these limitations falsely improving our outcome measure.
We did not have measures on how improvements on our three units impacted potentially delayed admissions on those units. We anticipate that, with spread to the rest of the hospital, we will have more power to impact this measure.
Next steps
Since achieving our goal for the 11 HM diagnoses, we have begun working on improving discharge efficiency for all HM patients, including complex patients with chronic conditions whose discharge criteria may differ from previously healthy patients with the same diagnoses. We have also begun testing the process on surgery patients. Once our goal is attained in these areas, we anticipate further spread to other services and units. As we spread this work, we are also evaluating our discharge processes, including discharge documentation, communication with outpatient providers and medicine reconciliation, with the goal of reducing preventable readmissions and medication errors.
Conclusions
Through standardisation of discharge goals and implementation of high-reliability interventions, we improved discharge timeliness, reducing LOS without increasing readmission rates.
Acknowledgments
The authors would like to thank nursing staff on A6N, A6S and LA1W units, the CCHMC paediatric residents, our HM colleagues, Dave Mayhaus, Melissa Healey, Dr Karen McDowell, Paul Yelton, Mindy Corcoran, Shelly Miller, Jenny Pansing, Gayle Lykowski, Debbie Jenkins, Dr Betsy Gerrein, Kim Kaas, Dr Kevin Reidy and Dr Patrick Brady for their help in completing this project.
References
Supplementary materials
Supplementary Data
This web only file has been produced by the BMJ Publishing Group from an electronic file supplied by the author(s) and has not been edited for content.
Files in this Data Supplement:
- Data supplement 1 - Online supplement
- Data supplement 2 - Online supplement
- Data supplement 3 - Online supplement
- Data supplement 4 - Online supplement
- Data supplement 5 - Online supplement
- Data supplement 6 - Online supplement
Footnotes
-
Contributors All of the listed authors are responsible for the reported research. We have participated in the concept and design, analysis and interpretation of data, and drafting and revising of the manuscript. We all approve the manuscript as submitted. CMW, AMS, DLW, DE, KT, DH, SDW, DMW, JH, AS, PK, MF, UK and FCR contributed to the conception and design of the project. CMW, AMS, DLW, DE, KT, DH, SDW, DMW, JH and AS contributed to the acquisition of the data. CMW, AMS, DLW, DE and PJS contributed to the analysis and interpretation of the data. CMW, AMS, DLW, DE and PJS drafted the manuscript. CMW, AMS, DLW, DE, MF, UK and FCR contributed to the critical revision of the manuscript for important intellectual content.
-
Competing interests None.
-
Ethics approval This study was reviewed by the CCHMC institutional review board and deemed exempt systems improvement.
-
Provenance and peer review Not commissioned; externally peer reviewed.