Article Text

Abstract
AIMS To investigate the effect of motor and cognitive disabilities on the survival of people on the North of England Collaborative Cerebral Palsy Survey, and compare this with other published results.
METHODS The cerebral palsy cohort consists of 1960–1990 births in Northumberland, Newcastle, and North Tyneside health districts. Survival and cause of death were analysed in relation to data on birth, disabilities, and a unique measure of the impact of disability.
RESULTS Disability strongly influences survival. More than a third of those with a severe disability die before age 30. Fewer than a third of deaths are attributed to cerebral palsy on death certificates. Of those with severe cognitive disability, 63% live to age 35 (58% with severe ambulatory disability and 53% with severe manual disability), whereas at least 98% without severe disabilities live to age 35. The Lifestyle Assessment Score (LAS) allows a finer categorisation of impact of disability, and is strongly associated with survival: a ten point increase in LAS is associated with a doubling of the hazard rate. People who had LAS of at least 70, and had survived to age 5 have a 39% chance of dying before age 35.
CONCLUSIONS The majority of people with cerebral palsy attain adulthood. There appears to be more variation in survival rates associated with severe disability between regions of England, than between north east England, British Columbia, and California. Instantaneous risks of dying vary widely between England and California. This variation is not obviously attributable to differing rates of severe disability.
- cerebral palsy
- birth weight
- cohort study
- cognitive and motor disabilities
- life expectancy
- north east England
Statistics from Altmetric.com
- cerebral palsy
- birth weight
- cohort study
- cognitive and motor disabilities
- life expectancy
- north east England
Cerebral palsy is one of the most common causes of childhood disability, and its prevalence increased in England from 1967 to 1984.1 ,2 Although a study in North Carolina reported a decline in cerebral palsy in very low birthweight infants in the 1980s,3 the rate, 10.8%, was higher than the rate in England and Scotland, which was 6.8%.4 As therapies intended to improve the health of neonates develop, it is important to assess the effects on length and quality of life.
Effective planning of resources to provide services to meet the care needs of children requires knowledge of the health and social needs of the individual. It also requires detailed knowledge of the birth prevalence and expected survival of children with specific conditions in order to assess the overall number of cases which require care over time. A measure of severity is also needed in order to have some idea of the degree of dependency on care which will be required. Very little of this care will be provided through legal settlements. A realistic estimate of the percentage of cases of cerebral palsy which are of intrapartum origin is 10%,5 and the majority of children do not receive compensation.
The effect of motor and cognitive disabilities on the survival of people with cerebral palsy has been described for population cohorts in England and British Columbia, and services users in California.6-11 The British and Canadian studies use broad categories of disabilities: a finer categorisation was used in the Californian study. Expectation of life is lower in people with more severe disabilities, but even they have a good chance of surviving into adulthood. The reduction in survival associated with disability appears to vary between regions and countries.
The North of England Collaborative Cerebral Palsy Survey (NECCPS) contains information on people with cerebral palsy, born between 1960 and 1990, and contains more detail on the impact of disability than other United Kingdom Cerebral Palsy Registers.
Methods
People with cerebral palsy in the Northumberland, Newcastle, and North Tyneside health districts in north east England, born between 1960 and 1990, form the initial cohort of the NECCPS, which has been described previously.12 These people were flagged at the Office for National Statistics National Health Service Central Register (NHSCR), where all deaths are registered.
Data on sex, birth weight, and gestational age were recorded, as were data on disabilities. Cognitive disability was defined as severe if IQ was below 50, if formally assessed, or by clinical judgement. Children who were unable to feed or dress themselves were regarded as severely manually disabled. Those with no independent walking were regarded as having severe ambulatory disability. In addition to assessments of cognitive and motor disability, a measure of the overall impact of disability is a unique feature of this survey. This measure is the Lifestyle Assessment Score (LAS),13 an instrument which includes both medical and social experiences. It measures the impact of cerebral palsy on children and their families, using the range 0–100%. A questionnaire yields scores in six dimensions: physical independence, clinical burden, mobility, schooling, economic burden, and social integration. The LAS combines these scores using weight derived from ratings of paediatricians, parents of children with cerebral palsy, and parents of children without disability. A typical child with LAS of 30% completes most activities alone, poses little economic burden, and attends mainstream school; with an LAS of 50%, a typical child needs assistance in many self help activities, limits the socioeconomic status of the family, and requires educational support. A child with LAS of 70% undertakes very few self help tasks, experiences severe economic effects, and is in a specialised educational setting.
We are notified by NHSCR of dates of death for those who have died, and are provided with death certificates, and cause of death codes using the 9th ICD,14 for most of those who have died. In order to allow for the time lag in notification of death, the date 29 February 2000 was chosen to be that at which ages are defined, and before which deaths should have occurred.
The survival is summarised using actuarial life tables, and the effect of disabilities assessed using the log rank test, which compares observed and expected numbers of deaths.15 For life tables, LAS and birth weight are categorised. Survival is further investigated by fitting univariate and multivariate accelerated life and Cox proportional hazards models15; LAS and birth weight are continuous in these analyses. These models compare the pattern of survival for particular covariate values with that of a referent subset of the cerebral palsy cohort. The effect of disabilities and LAS can be modelled using a Weibull survival model, in which the instantaneous risk of death is constant, or increases or decreases with time. For comparison with some other published results, estimates from the Cox proportional hazards models are given.
Results
BIRTH CHARACTERISTICS
There were 781 people in the NECCPS, born 1960–1990, of whom 13 could not be traced by NHSCR. Of the 768 who can be studied, 116 were born outside the region, and 71 had postneonatally acquired cerebral palsy (15 of these were outborn). Data on severity of disability are not available on all people for the following reasons: LAS were not sought on 1960–63 births (137 children); a random sample (63 children) were not assessed in 1964–1974 births; and 34 children had moved before they were assessed. As these data are missing for reasons not associated with survival, they are missing at random, and the results will not be affected.
The survival rates of those with postneonatally acquired cerebral palsy were not significantly different from those with cerebral palsy not acquired postneonatally (40 year survival rates 80.1% and 83.5% respectively). Those born outside the region had the same survival as those born within the region: 40 year survival rates 82.9% and 83.2% respectively. For this study, those with postneonatally acquired cerebral palsy were excluded as a different clinical group. Those born outside the region are excluded to leave a geographically based cohort of 596 people, of whom 78 have died.
Table 1 shows the main characteristics of the cohort. There are more males than females, in the ratio 1.3:1. A fifth were born before 32 weeks, and 38% were low birth weight (less than 2500 g). Over a quarter of the people had severe cognitive, manual, or ambulatory disabilities. Few had severe vision hearing or disabilities. The maximum LAS was 85, and a sixth of the recorded LAS were over 70.
Characteristics of 596 people with cerebral palsy not acquired postneonatally (NECCPS, 1960–90)
Table 2 shows the association between birth weight and disabilities. The percentage of people with cognitive disabilities decreases from 34% in the normal birth weight group, to 23% in the very low birth weight groups. In contrast, about a quarter have severe manual disability, and a sixth LAS of at least 70, in all three birth weight groups. Slightly fewer among those of normal birth weight have severe ambulatory disability, than the third in the low birth weight groups.
Association between severe disabilities and birth weight for 596 people with cerebral palsy (NECCPS, 1960–90)
SURVIVAL AND THE EFFECT OF SEVERITY OF DISABILITY
For women, the survival rate to age 40 is 82.8% (approximate 95% confidence interval (CI) 77.1%, 88.5%) and for men, 82.5% (95% CI 78.4%, 88.6%), substantially less than for the general population (table 3). In the official statistics for the population of England and Wales, 1973–1975, the life table gives the 40 year survival rate as 96.7% for women and 95.0% for men.16
NECCPS: 10, 20, 30, and 35 year survival for 596 people
Table 3 gives the survival rates to ages 10, 20, 30, and 35 years, using available severity data. Infants with birth weight in the range 2500–3499 g have the poorest 35 year survival rate, 76.0% (95% CI 69.1%, 82.9%) Those of low birth weight, 1500–2499g, have better survival, 84.2% (95% CI 76.6%, 91.8%), as do infants weighing over 3500 g (86.6%; 95% CI 79.9%, 93.3%). Very low birth weight infants have even higher 35 year survival, 97.9% (95% CI 93.2%, 100%). There is a similar pattern with gestational age, though as there are incomplete data, the differences in survival do not reach statistical significance. Those born in the 1970s have poorer survival than those in the previous and following decades.
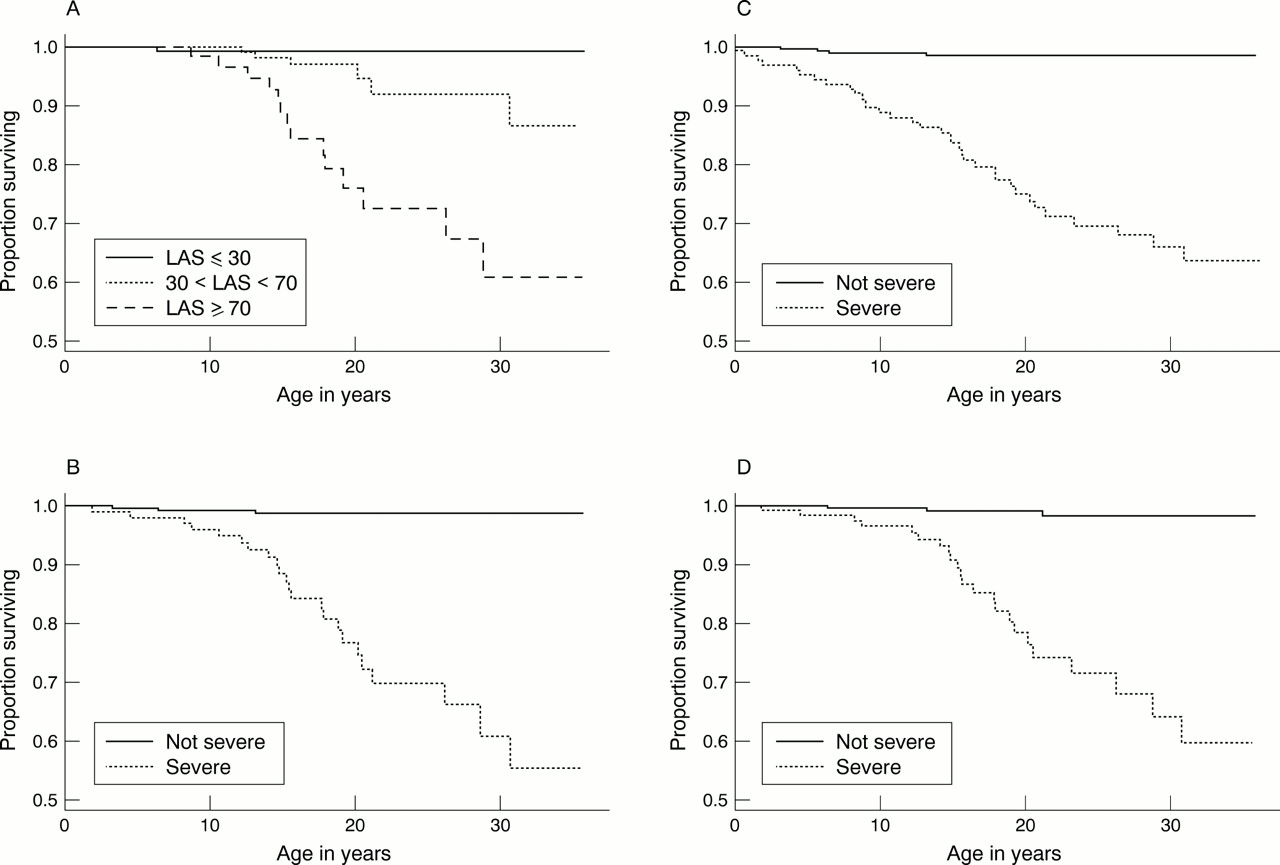
The lifestyle assessment questionnaire was completed by 355 people in this cohort, and some disability data were recorded for 408 people. Only one of those who died before age 5 has an LAS. For covariates which record disability, at least 75% of the data which are missing are missing at random for reasons given above, so estimates of survival are unlikely to be affected much by the incompleteness of the covariates. For those with LAS of at least 70, who have to survive to age 5 to be assessed by LAS, the 35 year survival rate is 60.8% (95% CI 41.8%, 79.8%) (see fig 1A). Those with moderately high LAS scores, in the range 50 to 70, have a 73.0% (95% CI 47.7%, 98.3%) chance of dying before age 35. These are much lower than the general population survival rates from age 5 to age 35 (98.8% for women and 97.8% for men).16 For those with very mild cerebral palsy (LAS less than 30), the rate of 99.2% (95% CI 94%, 100%) is essentially the same as for the general population, and slightly poorer, 98.5% (95% CI 98.8%, 100%), for those with moderate cerebral palsy. Figure 1A shows that for people with LAS of at least 70, the proportion surviving declines steadily after age 10.
Survival of people with cerebral palsy, with different levels of disability. (A) Lifestyle assessment score (LAS); (B) manual disability; (C) cognitive disability; (D) ambulatory disability.
Almost all people without severe cognitive and motor disabilities live to age 30 (see fig 1B–D). For those with severe cognitive disability, the survival declines steadily, and is 62.9% (95% CI 52.3%, 73.5%) at age 35. The rate is slightly lower for those with severe mobility restrictions, 59.0% (95% CI 43.5%, 74.5%), and lower for those with severe manual disability, 54.6% (95% CI 37.4%, 71.8%).
Cox proportional hazards models give an estimated risk of dying 18.3 times higher (95% CI 6.5%, 51.6%), throughout the period of study, for those who are severely cognitively disabled, compared with those in the cohort who are not. Those with severe manual disability have a risk of dying 24.9 times higher (95% CI 7.5%, 83.1%) than those without. Those with severe ambulatory disability have a risk of dying 21.9 times higher (95% CI 6.6%, 73.0%) than those who can walk independently. A ten point increase in LAS is associated with an increased risk of dying of 2.1 (95% CI 1.5, 3.0), and with a 40 point increase in LAS the risk increases to 20.7 (95% CI 5.4, 79.6). Survival is poorest for birth weight 3000 g, and is better for larger as well as smaller birth weights. A birth weight of 2000 g is associated with a decreased risk of dying relative to birth weight 3000 g of 0.59 (95% CI 0.40, 0.89) and a 4000 g birth weight with a decrease of 0.51 (95% CI 0.27, 0.99). The fitted Weibull model indicates that when considering the presence or absence of severe disabilities, the instantaneous risk of dying increases slowly with age, whereas in the models for LAS and birth weight, the instantaneous risk decreases slightly.
In order to investigate which of the individual disabilities or LAS are most strongly associated with survival, multivariate Weibull and Cox models were fitted to the data for the 350 people for whom all data on LAS and disabilities were available. Although cognitive disability is associated with the largest relative risk in the univariate analyses, for the subset on people with complete data, severe manual disability and the LAS are most strongly associated with survival. After allowing for the effect of manual disability or LAS, other variables have no additional explanatory value.
CAUSE OF DEATH
The increased mortality of this cohort is only partly attributed on death certificates to cerebral palsy. Death certificates have been received for 73 people who were born in the study region and had cerebral palsy. The median age at death was 10.5 years (quartiles 4.4, 18.8 years), and the oldest death so far was at 31 years. Cerebral palsy was the most common underlying cause of death, recorded for 29% of deaths (21/72; no underlying cause is given for the youngest infant). There was no mention of cerebral palsy on 46% of certificates. Pneumonia accounted for a further 18% of deaths, epilepsy for 7%, and congenital abnormalities for 8%. The percentage with cerebral palsy given as underlying cause, and percentage mentioning cerebral palsy are comparable to the results from the Thames and Mersey regions.17 ,18 All respiratory underlying causes of death account for only 19% (including one bronchitis) in this cohort and 22% in the Mersey cohort, whereas in Thames region this group accounted for 27% of deaths.
Discussion
The survival of all children in this cohort who are not severely disabled is high. More than half of even the most severely disabled individuals live to age 35. The survival of people with cerebral palsy is most influenced by cognitive and motor disabilities. The LAS is strongly associated with survival: people with LAS of at least 70 had a 39% chance of dying before age 35. The LAS allows more detailed categorisation of impact of disability on survival: each point increase in LAS is associated with slightly poorer expected survival, and a 10 point increase is associated with a doubling of the hazard rate. Low birth weight infants have better survival rates than infants with weight 3000 g. This is consistent with the findings from other studies, and is thought to be a result of severely damaged premature infants being less likely to survive until diagnosis than full term infants. The heavier infants, birth weight 4000 g, also have poorer survival. These infants might be postmature, or more likely to have had adverse intrapartum events: these possibilities should be investigated in future research.
REGIONAL VARIATION IN SURVIVAL
Table 4 gives reported survival rates to various ages. The univariate association of cognitive disability and survival of people with cerebral palsy is similar in two English cohorts and a Canadian Registry.8 Californian survival rates for adults9 and children10 with manual and ambulatory disabilities are broadly comparable with those in north east England. The survival of disabled children with cerebral palsy in North and South East Thames (SET),6 and Mersey (MCPR)7 appears to be lower than that of this cohort.
Comparison of survival rates to various ages for study populations in UK, Canada, and USA
The estimated hazard rates (or instantaneous risks of dying) for those with severe motor and cognitive disabilities compared to the remainder of this cohort appear to differ from those in SET,6 and the paediatric Californian (CAL) study10 (see table 5).The published estimates for the latter two studies are from multivariate Cox proportional hazards models, whereas our analyses have used both Cox and Weibull univariate regression models. We used univariate models as only one variable at a time is significant. Those in this cohort with severe cognitive disability have higher relative risk than the estimates for SET for being severely subnormal and for CAL for severe or profound mental retardation. Severe manual disability is associated with a very much higher relative risk in this cohort, than the risk for no functional hand use, in CAL. For ambulatory disability, the risks in SET and our cohort are somewhat higher than the range of values given for various detailed classifications of immobility for Californian children. The two English estimates have quite wide confidence intervals, so the differences might be partly sample based. The California children appear to have lower relative risks, so it is important to consider how the populations might differ.
Comparison of hazard rates from proportional hazards models for study populations in UK, Canada, and USA
COMPARISON OF STUDY POPULATIONS
A possible explanation of the differences in survival, and risks, might be the composition of study populations and the choice of definitions of disability (see table 6). The prevalence of males, low birth weight, and disabilities in this cohort population is similar to those of MCPR7 and SET6 (see table 4). The three north American study populations have a slightly lower percentage of males.8-10 Only a quarter of the paediatric subset of the Californian study population are “low birth weight/decreased gestational age”. No information on birth weight or gestational age is given for the adult Californian study population or the British Columbia Registry. Rates of severe cognitive retardation are somewhat higher in the paediatric and adult Californian studies. In contrast, only 16% of those on the British Columbia Registry were classified as severely or profoundly cognitively retarded. Very few of the adult Californians are classified as having severe manual disability (10%). Ambulatory disability occurs in just over a quarter of the three British study populations, but in far more of the Californian populations: 73% of children and 35% of adults.
Comparison of study populations in UK, Canada, and USA: percentages with particular characteristics
The association between birth weight group and cognitive disability is very similar in MCPR and this cohort. However, for manual dexterity, this cohort shows no association, whereas MCPR has increasing rates of disability with increasing birth weight. For ambulation, the rate decreases slightly with birth weight in this cohort, but increases with birth weight for MCPR.
These differences in prevalence of low birth weight and disabilities indicate that somewhat different populations have been studied, or that definitions of severity vary. The largest differences occur for ambulation, where being confined to bed or a wheelchair is often part of the definition. For the Californian paediatric population, the most severe reported category was “does not walk”.10 The lower rates of cognitive and manual disability in the adult Californian population might be explained by the higher death rates associated with disability: the most disabled children do not survive to adulthood. However, this explanation would predict lower rates of severe mobility restriction, which is not the case.
It is surprising that there appears to be more variation in survival between regions of England, than between north east England, British Columbia, and California, especially as the cerebral palsy study populations in England have similar rates of disability. As different definitions and populations have been studied, relative risks within studies cannot simply be compared between studies, because the subsets used as the baseline categories are likely to vary. Several explanations are possible. Several of the results given here have been read off figures in publications, and different papers present information in different ways. The definitions of severity might vary, and be applied differently by clinicians. The MCPR and this cohort include children born in the 1960s, whereas the Thames Registers begin in the 1980s. There is some evidence that those born in the 1970s have poorer life expectancy, so birth cohort effects might explain some of the variation, but more time is needed to clarify this pattern.
CONCLUSIONS
Further information on determinants of survival, as well as resource use and development of treatment and support services for those with cerebral palsy and their families is needed. A detailed knowledge of the birth prevalence, expected survival, and overall severity of disability of children with specific conditions is essential for such resource and service planning. However, such knowledge only begins to address the need for a broader evidence base on the health and social care needs of children with cerebral palsy and other chronic conditions. Careful longitudinal study of the quality of life and the emotional or psychological impact which such conditions have on the children and their families will be necessary to understand what may be termed the “natural history” of the condition and the changing pattern of disability over time. Only when these issues are known will a true picture of need be drawn.
Acknowledgments
We thank Edmund Hey and Steve Jarvis for encouraging us to use the data contained with the NECCPS, and Robyn Marley for maintaining the database. We thank the Office for National Statistics NHS Central Register for providing date and cause of death data. We acknowledge a grant from the Northern and Yorkshire Directorate of the National Health Service Executive, for date and cause of death data.
References
Commentary
Hutton and her colleagues in this paper have confirmed that the majority of individuals with cerebral palsy survive significantly into adult life, even those who have severe disabilities. By contrast 98% of subjects without severe disabilities in this study lived to and beyond 35 years of age. Quite clearly this and other papers on the subject indicate that appropriate resources for caring for disabled children and adults are required to be made available. On the medical front this includes the need for the provision of specialists for adults whose work will parallel that of paediatricians.
The paper is an addition to the literature available to clinicians who advise patients with cerebral palsy and their families, and also to those who are asked to provide medicolegal reports on life expectancy. It may reasonably be argued of course that doctors are not, and should not be expected to be experts on life expectancy,1-1 but in current practice this is the situation that pertains for relevant litigation in the UK. Under these circumstances data such as those provided by Hutton et al and others cited in their paper are used and the attempt is then made by clinicians to fine tune the estimate of the likely survival of individual children based on particular clinical characteristics. Hence it would have been very helpful if this study could have provided more detail about the patterns and degrees of disability that correlate with very limited survival, although it is wholly understandable that it has not been possible to do this.
For example, it would have been particularly helpful if Hutton and her coworkers could have subdivided cognitive disability to a greater degree than they have described. It is not surprising that they assert that an IQ (or its equivalent) below 50 correlates with a shorter life expectancy. Does therefore an IQ of 20 or less correlate with even shorter survival? There is certainly a clinical impression that it does, but given the difficulties of measuring cognitive and social abilities in individuals who are profoundly disabled it is unsurprising that the statistical data are unavailable to support this. It may be however, that the Lifetime Assessment Score used by the authors could be applicable in this way in other studies.
Similarly, with respect to motor disability, the clinical impression is gained that the more profound this is, the shorter is the period of survival of affected individuals. To a degree this is supported by the work of Strauss and Shavelle,1-2 but the Californian database on which that study is based may possibly not have the degree of clinical input into compiling and updating its data as would be ideal.
For clinicians practising in this field it would have been of interest to learn whether different patterns of cerebral palsy are related to life expectancy. However, the lack of an international consensus on how the cerebral palsy syndromes should be classified prejudices epidemiological studies on this point. It would also have been of interest to learn whether health factors, such as the presence or otherwise of scoliosis, nutritional status, or a requirement for tube feeding have an effect in the UK population. This last point is made within the context that elective gastrostomy feeding in profoundly disabled individuals appears to improve health, nutrition, and survival. The Californian study mentioned above suggests by contrast that tube feeding is an index of the most profound degree of disability and hence correlates with limited survival. While this is likely to be true in populations looked at retrospectively it may not apply to the same extent in the future.
The work of Hutton et al complements our developing knowledge of the epidemiology of the cerebral palsy syndromes and its value is enhanced by the collaboration of clinical expertise with that deriving from epidemiology and statistics. It is hopefully not too optimistic to anticipate that this multiprofessional collaboration can be extended to different geographical areas and that more systematic methodology, for example, in classifying the various cerebral palsy syndromes, will allow practitioners to obtain a better understanding and knowledge of the factors that constrain survival.
Linked Articles
- Rapid responses
- Rapid responses