


Abstract
Tuberous sclerosis complex (TSC) is an autosomal dominant disorder that is characterized by benign tumors (hamartomas and hamartias) involving multiple organ systems, due to inactivating mutations in TSC1 or TSC2. Here, we review recent advances in our understanding of the growth and signaling functions of the TSC1 and TSC2 proteins. Led by seminal studies in Drosophila, the TSC1/TSC2 complex has been positioned in an ancestrally conserved signaling pathway that regulates cell growth. TSC1/TSC2 receives inputs from at least three major signaling pathways in the form of kinase-mediated phosphorylation events that regulate its function as a GTPase activating protein (GAP): the PI3K-Akt pathway, the ERK1/2-RSK1 pathway and the LKB1-AMPK pathway. TSC1/TSC2 functions as a GAP towards Rheb, which is a major regulator of the mammalian target of rapamycin (mTOR). In the absence of either TSC1 or TSC2, high levels of Rheb-GTP lead to constitutive activation of mTOR–raptor signaling, thereby leading to enhanced and deregulated protein synthesis and cell growth. As a specific inhibitor of mTOR, rapamycin has therapeutic potential for the treatment of TSC hamartomas.
INTRODUCTION
Tuberous sclerosis complex (TSC) is an autosomal dominant genetic disease with an incidence of one in 6000 at birth, which is characterized by benign tumors (hamartomas and hamartias) involving multiple organ systems (1,2). Although many of its clinico-pathologic features have been known for over a century, little was known of its molecular pathogenesis until the past 5 years. In this article, we briefly review the clinical features and genetics of TSC, and then discuss recent advances in our understanding of the functional role of the TSC1 and TSC2 proteins, which have been identified as key players in an ancestral signaling pathway regulating cell size and proliferation.
CLINICAL FEATURES
Several TSC hamartomas are virtually pathognomonic of the disease, although two or more major features are required for formal diagnosis (3). TSC hamartomas occur at different developmental stages during the life of the patient. For example, cardiac rhabdomyoma, a distinctive benign neoplasm consisting of atypical myocytes filled with glycogen, is common in the perinatal period but decline in frequency thereafter and usually disappear by age 5 on ultrasound. Many other radiographic and cutaneous features are less prominent early in life and become more pronounced with age, typically at defined developmental epochs. TSC patients experience significant excess mortality due to brain involvement (status epilepticus, obstructive hydrocephalus, severe mental retardation leading to failure-to-thrive), renal involvement (renal failure, carcinoma and massive bleeding) and respiratory failure (progressive lymphangioleiomyomatosis, LAM)) (1,2). However, despite the abundance of benign tumors in TSC patients, malignancy is rare, being seen only in the kidney at a lifetime risk of 2–3% (4).
Central nervous system involvement in TSC includes the hallmark cortical tubers and subependymal nodules (5,6) (Fig. 1). The tubers of TSC are focal lesions with loss of normal cortical cytoarchitecture and occurrence of abnormal enlarged neurons, glial cells and less differentiated ‘giant’ cells. Cortical tuber number and size correlate roughly with two major clinical manifestations of TSC, seizures and mental retardation, which are seen in about 90 and 50% of TSC patients, respectively (7,8). A third major brain-related clinical manifestation of TSC is behavioral disorders, including autism and attention-deficit hyperactive disorder, which are seen in about one-third of TSC children (9).
Several different types of connective tissue hamartoma occur in the skin of nearly all TSC patients, including facial angiofibromas, ungual fibromas, Shagreen patch and forehead plaque (1,10). Renal angiomyolipomas (AMLs) occur in ∼80% of TSC patients by age 15, and consist of smooth muscle, adipose tissue and fibrous tissue (11). LAM is an infiltrative, proliferative lung lesion composed of aberrant smooth muscle cells and epithelioid cells with cyst formation and destruction of normal airways (12,13). LAM shows an extreme sex preference, as it occurs in 5–10% of adult female TSC patients, but is extremely rare in males (13).
TSC GENETICS
TSC is due to inactivating mutations in either of two genes, TSC1 or TSC2 (14). These mutations comprise the usual mix of nonsense, missense, insertion and deletion mutations, involving nearly all of the exons of TSC1 and TSC2, although both missense mutations and large genomic deletions are rare in TSC1 (14). About two-thirds of TSC patients are sporadic cases with no family history due to new mutational events (15–17). Although clinical expression of tuberous sclerosis varies greatly, in its classic form, there is 100% penetrance. Mutational studies of TSC patients have demonstrated that mutations in TSC2 are about five times more common than mutations in TSC1 in the sporadic TSC population, whereas the ratio is 1:1 in large families with multiple generations affected (15–17). Correspondingly, TSC1 disease is milder than TSC2 disease in multiple respects, which appears to be due to a reduced rate of second hit events (15,17). Recently, several families have been described in which there are unusually mild manifestations of TSC, with most ‘affecteds’ not meeting TSC diagnostic criteria, segregating with missense mutations in TSC2 (18,19).
For many years, the prevailing model has been that the hamartomas of TSC develop through a two-hit mechanism (one germline, one somatic) in which there is complete loss of expression of functional TSC1 or TSC2, supported by findings of loss of heterozygosity (LOH) in TSC tumor samples (20–24). However, the rate of LOH appears to vary according to lesion type, and LOH may not occur in all subependymal giant cell astrocytomas (SEGAs) and cortical tubers (21,23–25). On the other hand, recent evidence suggests that both tuber giant cells and SEGA cells have similar immunophenotypes, and SEGAs commonly sustain two-hit inactivation of either TSC1 or TSC2 (26,27).
CELL SIGNALING THROUGH TSC1/TSC2: CONNECTING Akt TO mTOR
Enormous progress has been made during the past 5 years in understanding the biochemical and signaling functions of the TSC1 and TSC2 gene products, hamartin (130 kDa) and tuberin (198 kDa), respectively (Fig. 2). A C-terminal domain within the TSC2 protein was recognized as being homologous to other GTPase activating protein (GAP) domains when it was cloned in 1993 (28). Following identification of TSC1 in 1997 (29), it was shown that the TSC1 and TSC2 proteins formed a complex in cells (30,31). However, progress was slow until seminal studies performed in Drosophila identified a role for Tsc1/Tsc2 in the control of cell size (32–34). In retrospect, the giant cells seen in TSC cortical tubers were a clue to the function of the TSC1/TSC2 genes.
Here, we review the signaling role of the mammalian TSC1/TSC2 complex, particularly recent advances and aspects of clinical relevance (Fig. 2). There are many recent reviews which provide greater biochemical detail (35–42).
Growth factors act on their cognate receptor tyrosine kinases to induce intracellular phosphorylation events that lead to recruitment of Type Ia phosphoinositide 3-kinases (PI3K) to the plasma membrane. PI3K phosphorylates membrane phosphoinositides at the 3′ position to generate PI(3,4,5)P3 and related lipids, which lead to recruitment of the ser/thr kinase Akt (PKB) to the membrane through its PH domain. Akt is then phosphorylated at S473 by the mTOR–rictor complex and other kinases, and at T308 by PDK1, thereby activating its kinase activity (43–45). Activated Akt directly phosphorylates several downstream targets, including members of the FOXO family of transcription factors, the proapoptotic Bcl-2 family member BAD, the ser/thr kinases GSK3α and β and the TSC2 protein (reviewed in 46 and 47). These phosphorylation events are generally inhibitory with respect to the function of these Akt targets and have survival-promoting anti-apoptotic effects.
In unstimulated conditions, the TSC1/TSC2 complex has strong and highly specific GAP activity toward Rheb (Ras homolog enriched in brain), a GTPase of the Ras superfamily (48–52). Upon growth factor stimulation, TSC2 is phosphorylated by Akt on at least five sites (S939, S981, S1130, S1132, T1462), and through an unknown mechanism, this phosphorylation inhibits the ability of TSC2 to act as a Rheb-GAP (53–56). Rheb is an atypical member of the Ras family in that it has unusually low intrinsic GTPase activity (57). TSC2 is the only known GAP for Rheb, so that in the absence of a functional TSC1/TSC2 complex, Rheb-GTP levels rise (51,52,58,59). Rheb-GTP levels can also be increased by simple over-expression of Rheb, with similar effects as loss or inhibition of TSC1 or TSC2 (51,52,57–59).
Rheb-GTP levels have a major role in regulating the state of activation of the mammalian target of rapamycin (mTOR) protein. mTOR is a highly conserved ser/thr kinase, first identified as the ultimate target of inhibition of the immune suppressant rapamycin (reviewed in 60 and 61). mTOR is present in cells in a high molecular weight multimeric complex, whose components are not completely identified. However, mTOR is known to form two functionally distinct complexes: the rapamycin-sensitive mTORC1, consisting of mTOR, raptor and GβL and the rapamycin-resistant mTORC2, consisting of mTOR, rictor and GβL (62–66). mTORC2 phosphorylates Akt on S473 (44), and has a role in regulation of the actin cytoskeleton (66,67), but does not appear to be directly affected by signaling events through the TSC1/TSC2 complex and Rheb (44,67). mTORC1 is activated upon an elevation in Rheb-GTP levels, although the precise mechanism is not clear (60,61). In one report, Rheb bound directly to the mTOR catalytic domain, but with unusual characteristics and specificity for an interaction between a small G protein and an effector (68). In addition to growth factors, mTORC1 activity is tightly controlled by the availability of intracellular amino acids (69). However, there are conflicting reports for the role of Rheb in this regulation (60,61,68,70).
Activated mTORC1 has two primary downstream targets, the ribosomal S6 kinases (S6K1 and S6K2) and the eukaryotic initiation factor 4E (eIF4E)-binding protein (4E-BP1) (reviewed in 35–38 and 40). Although activation of S6K1 and S6K2 is complex, requiring phosphorylation on many sites by several distinct kinases, mTOR-mediated phosphorylation is a final step that is absolutely required. Activated S6K1 and S6K2 phosphorylate the ribosomal protein S6, SKAR, eIF4B and unknown targets to stimulate cell growth (71,72). The mechanism of this stimulation is uncertain but appears to include altered translation of specific mRNAs (72). mTOR-dependent phosphorylation of 4E-BP1 causes it to dissociate from eIF4E and permits formation of translation–initiation complexes, leading to accelerated protein synthesis and cell growth. The importance of eIF4E in controlling cell proliferation, growth and even survival is indicated by its transforming ability (73,74).
SIGNAL INTEGRATION AT THE TSC1/TSC2 NODE
A highly conserved (found even in plants) cellular energy sensing pathway is directly connected to the above pathway at the TSC1/TSC2 node (reviewed in 39). AMP-activated protein kinase (AMPK), a heterotrimeric complex encoded by several genes, is the primary energy sensor in cells. Upon depletion of intracellular ATP, AMP levels rise and bind to an AMPK regulatory subunit. AMP binding puts AMPK in a conformation that makes it accessible to its upstream activating kinase(s), including LKB1, which phosphorylates the activation loop of the AMPK catalytic subunit at T172 (75–77). Once activated, AMPK phosphorylates and influences many downstream targets. Among these, AMPK phosphorylates TSC2 at two sites (S1270, S1388) distinct from the Akt sites (78). In contrast to the phosphorylation of TSC2 by Akt, AMPK-mediated phosphorylation somehow enhances the ability of the TSC1/TSC2 complex to act as a Rheb-GAP, and therefore blocks Rheb-dependent mTOR activation under conditions of energy stress. It is interesting to note that the AMPK-activating kinase LKB1 is encoded by a tumor suppressor gene associated with hamartoma development, similar to TSC1/TSC2, and its loss also leads to cells and tumors with elevated mTOR activity (79,80).
Recent studies have also illuminated an important connection between the growth factor-stimulated MAPK pathway and TSC1/TSC2. Both ERK1/2 and its downstream target RSK1 phosphorylate TSC2 at sites distinct from the major Akt sites (ERK1/2: S540, S664; RSK1: S1798) (81,82). These events also negatively regulate the Rheb-GAP activity of the TSC1/TSC2 complex, so that ERK1/2-RSK1 pathway activation also activates mTOR. ERK1/2-mediated phosphorylation of TSC2 also appears to disrupt the TSC1/TSC2 complex (82). There are multiple other phosphorylation sites on both TSC1 and TSC2 (83), the function of which are currently unknown. Interestingly, cyclin-dependent kinase 1/cyclin B complexes have been shown to phosphorylate TSC1 and could play a role in cell-cycle stage-dependent regulation of the TSC1/TSC2 complex (84). Combinatorial analyses of the role of these multiple phosphorylation sites on TSC1/TSC2 complex formation, protein stability and GAP activity present major technical challenges but are necessary to fully understand the complex in vivo regulation of TSC1/TSC2.
Various cellular stresses also appear to impact the function of TSC1/2-Rheb-mTOR signaling. However, the regulatory mechanisms are poorly understood at present. For instance, hypoxia, through induction of REDD1 expression, inhibits mTOR activity in a TSC1/TSC2-dependent manner (85,86). However, the molecular connections between REDD1 and the TSC1/TSC2 complex are currently unknown.
INDEPENDENT FUNCTIONS OF TSC1 AND TSC2
Although functions for the individual TSC1 and TSC2 proteins have been proposed, it is not clear that either protein acts independent of the complex. Loss of TSC1 eliminates formation of the TSC1/TSC2 complex and leads to biochemical consequences in terms of mTOR signaling and cell physiology, which are identical to those seen due to loss of TSC2 (87). TSC2 levels are reduced in cells lacking TSC1, suggesting that binding to TSC1 increases the half-life of TSC2 and may serve to localize TSC2 to important intracellular domains. Missense mutations within TSC2 disrupt formation of the TSC1/TSC2 complex in most cases (88). The missense mutations in TSC2 detected in the rare mild familial cases of TSC may have relatively normal binding to TSC1 and partial GAP activity, but this remains to be tested.
Multiple other binding partners for each of TSC1 and TSC2 have been identified by various means. However, the stoichiometry of these interactions appear quite low in general and their physiological significance is currently unknown.
PATHOGENESIS OF HAMARTOMA DEVELOPMENT IN TUBEROUS SCLEROSIS
The TSC1/TSC2 complex has a critical role in the regulation of the state of activation of Rheb and downstream of Rheb, mTOR (Fig. 2). In cells lacking either TSC1 or TSC2, there is an absence of a functional TSC1/TSC2 complex and a consequent elevation of Rheb-GTP levels. This leads to growth-factor-independent and energy-stress-insensitive activation of mTOR signaling (48,49,51,52). This aberrant mTOR activity is most easily assessed in pathologic material by immunostaining for phosphorylated S6 (pS6) and has been seen in a variety of TSC hamartomas from patients and mouse models (26,27,89,90). Therefore, the current model is that high levels of unregulated mTOR–raptor activity lead to the growth and differentiation defects that are seen in TSC hamartomas. However, it is unclear whether this model explains all of the specific clinical features and variety of tumors that constitute the TSC disease.
Because the predominant clinical manifestations of TSC (seizures and developmental delay) are due to cortical tubers, there is great interest in understanding their pathogenesis. Tubers arise during early cortical development, and tuber giant cells are likely the primary or inciting cell type, arrested at an immature stage (reviewed in 5). Tuber giant cells express neuroprogenitor markers, aberrant patterns of neuro-receptors and some markers of proliferation. Tubers do not show evidence for LOH or second hit inactivation (21,23–25), but this evidence is hard to obtain given the admixture of giant, dysplastic and reactive cells within these lesions. However, the finding of two-hit TSC1 or TSC2 inactivation in SEGA giant cells (27), and the similarities between tuber and SEGA giant cells suggest that two-hit inactivation does occur in at least some tuber giant cells. However, SEGAs also express high levels of phospho-Akt and phospho-ERK1/2, in contrast to other TSC hamartomas, suggesting an alternative second hit mechanism that may involve other elements of the Akt or MAPK signaling pathways (26).
Recent work has also provided insight into the observation that malignancy is quite rare in TSC, seen only in the kidney at a relatively low rate (2–3% lifetime risk) (4). Cells lacking TSC1 or TSC2 display a counter-regulatory growth-inhibitory effect in which there is a striking attenuation of Akt activation in response to serum and other growth factors (87,91,92). Two major alterations have been seen that account for this effect: first, there is down-regulation of expression of PDGFR (87); secondly, there is reduction in the expression and function of the IRS proteins (93,94). As Akt has multiple targets that promote cell growth and survival, this effect may account for the lack of malignant potential of TSC hamartomas. This model is supported by recent observations on the interaction between Tsc2 and Pten alleles in vivo. TSC-related tumors (liver hemangioma) in Tsc2+/− mice exhibit defects in Akt signaling and are slow growing, whereas liver hemangioma in Tsc2+/−Pten+/− mice are much more severe and display activation of Akt (95).
THERAPEUTIC PROSPECTS
It is a remarkably fortuitous event that a major defect in cells lacking Tsc1/Tsc2 is the activation of the mTOR–raptor complex, which is the specific target of rapamycin. Rapamycin and analogs at nanomolar concentrations block the kinase activity of mTOR–raptor and cause a rapid reversal of phosphorylation changes due to mTOR seen in Tsc1/Tsc2 null cell lines. It is also effective in reducing tumor growth in rodent models of TSC (96,97). As rapamycin was previously approved by the FDA for the prevention of immune rejection in kidney transplant, it has moved rapidly into clinical trials for TSC. The preliminary results of Phase I trials are encouraging (J. Bissler, U. Cincinnati, personal communication). However, trials in larger number of patients and for longer periods are needed to more reliably assess its therapeutic potential and patient tolerance. In addition, the therapeutic potential of rapamycin for treatment of cortical tubers and their clinical consequences seems limited.
ACKNOWLEDGEMENTS
The authors wish to thank the NIH NINDS, the Rothberg Courage Fund, the Leukemia and Lymphoma Society and the Tuberous Sclerosis Alliance for support. They also regret the lack of a more complete discussion and many citations due to space limitations.
Conflict of Interest statement. The author has had research support from Novartis.
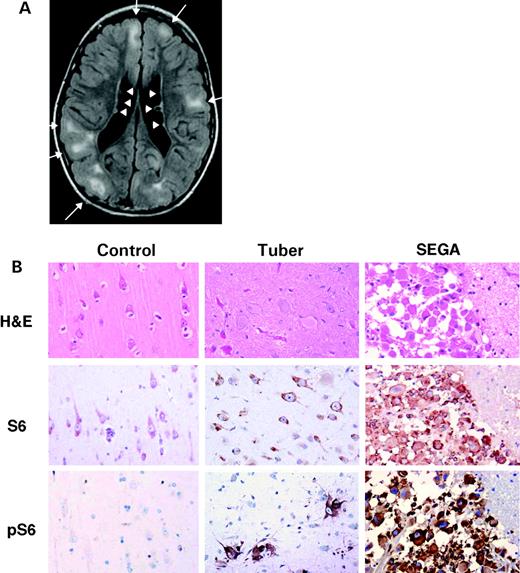
Figure 1. Brain findings in tuberous sclerosis. (A) Brain MRI of an 8-year-old boy using the FLAIR technique demonstrates several cortical tubers (white lesions indicated by arrows) and subependymal nodules lining the ventricles (arrowheads). (Courtesy of J. Egelhoff, Cincinnati.) (B) Giant cells of tubers and SEGAs from TSC patients. First column is control brain, second column is tuber and third column is SEGA. Hematoxylin and eosin stained sections demonstrate typical histology of normal cortex, tuber and SEGA. Note both nuclear and cytoplasmic enlargement in the giant cells of the TSC lesions. Immunohistochemistry with anti-S6 antibody, recognizing total S6 protein, shows moderate cytoplasmic positivity in most neurons, as well as tuber giant cells and SEGA cells. A phospho-specific antibody directed against pS6(Ser235/236) reacts strongly with the giant cells in tubers and SEGAs, indicating activation of mTOR, with no reactivity in control tissue. All images are at the same magnification. (Courtesy of Jennifer Chan, Brigham and Women's Hospital.)
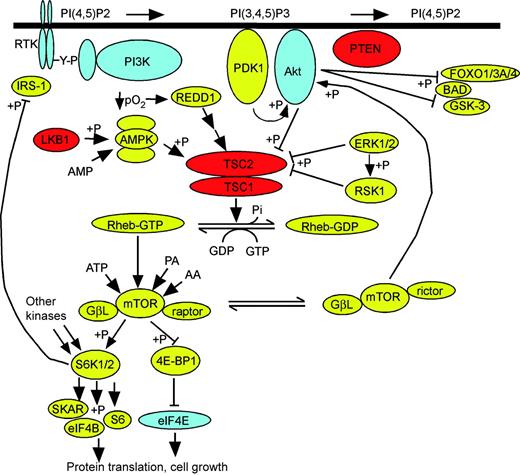
Figure 2. TSC1/TSC2 at the crossroads of multiple signaling pathways. Receptor tyrosine kinases (RTK, upper left) undergo tyrosine phosphorylation (Y-P) in response to extracellular growth factor binding, which leads to recruitment of PI3K, which phosphorylates membrane PI(4,5)P2 at the 3′ position to generate PI(3,4,5)P3. This lipid leads to recruitment of Akt to the membrane where it is phosphorylated by PDK1 and mTOR–rictor. Akt phosphorylates several other proteins (FOXO isoforms, BAD, GSK3 isoforms; at right) as well as TSC2. TSC2 is also phosphorylated in a fashion inhibitory to its GAP activity by both ERK1/2 and RSK1. LKB1 phosphorylates and activates AMPK in the presence of AMP, which then phosphorylates TSC2 and augments its GAP activity. Hypoxia (↓/pO2) leads to the expression of REDD1, which augments TSC2 GAP activity as well. TSC1/TSC2 acts as a GAP for Rheb-GTP enhancing conversion to Rheb-GDP. Rheb-GTP may bind directly to the mTOR–raptor complex and strongly enhances its kinase activity, which is also influenced by levels of ATP, phosphatidic acid and amino acids. mTOR–raptor phosphorylates S6K1/2 and 4E-BP1. S6K1/2 phosphorylates several targets to lead to selectively enhanced protein translation, whereas phosphorylated 4E-BP1 releases eIF4E which is then free to participate in translational initiation complexes; both of these effects lead to cell size increase and cell growth. The negative feedback inhibition of S6K1/2 on IRS levels through phosphorylation is also shown; the negative feedback on PDGFR expression is not shown, as the mechanism is not known. Arrowheads indicate functional enhancement; flat bars indicate functional suppression; +P denotes phosphorylation event. Proteins in blue are dominantly acting proto-oncogenes; proteins in red are tumor suppressor genes.
References
Gomez, M., Sampson, J. and Whittemore, V. (eds) (
Curatolo, P. (
Roach, E.S., Gomez, M.R. and Northrup, H. (
Al-Saleem, T., Wessner, L.L., Scheithauer, B.W., Patterson, K., Roach, E.S., Dreyer, S.J., Fujikawa, K., Bjornsson, J., Bernstein, J. and Henske, E.P. (
Crino, P.B. (
DiMario, F.J., Jr. (
Goodman, M., Lamm, S.H., Engel, A., Shepherd, C.W., Houser, O.W. and Gomez, M.R. (
Shepherd, C.W., Houser, O.W. and Gomez, M.R. (
Prather, P. and de Vries, P.J. (
Webb, D.W., Clarke, A., Fryer, A. and Osborne, J.P. (
Ewalt, D.H., Sheffield, E., Sparagana, S.P., Delgado, M.R. and Roach, E.S. (
Moss, J., Avila, N.A., Barnes, P.M., Litzenberger, R.A., Bechtle, J., Brooks, P.G., Hedin, C.J., Hunsberger, S. and Kristof, A.S. (
Urban, T., Lazor, R., Lacronique, J., Murris, M., Labrune, S., Valeyre, D. and Cordier, J.F. (
Cheadle, J.P., Reeve, M.P., Sampson, J.R. and Kwiatkowski, D.J. (
Dabora, S.L., Jozwiak, S., Franz, D.N., Roberts, P.S., Nieto, A., Chung, J., Choy, Y.S., Reeve, M.P., Thiele, E., Egelhoff, J.C. et al. (
Jones, A.C., Shyamsundar, M.M., Thomas, M.W., Maynard, J., Idziaszczyk, S., Tomkins, S., Sampson, J.R. and Cheadle, J.P. (
Sancak, O., Nellist, M., Goedbloed, M., Elfferich, P., Wouters, C., Maat-Kievit, A., Zonnenberg, B., Verhoef, S., Halley, D. and van den Ouweland, A. (
O'Connor, S.E., Kwiatkowski, D.J., Roberts, P.S., Wollmann, R.L. and Huttenlocher, P.R. (
Khare, L., Strizheva, G.D., Bailey, J.N., Au, K.S., Northrup, H., Smith, M., Smalley, S.L. and Henske, E.P. (
Au, K.S., Hebert, A.A., Roach, E.S. and Northrup, H. (
Carbonara, C., Longa, L., Grosso, E., Mazzucco, G., Borrone, C., Garre, M.L., Brisigotti, M., Filippi, G., Scabar, A., Giannotti, A. et al. (
Green, A.J., Smith, M. and Yates, J.R. (
Henske, E.P., Scheithauer, B.W., Short, M.P., Wollmann, R., Nahmias, J., Hornigold, N., van Slegtenhorst, M., Welsh, C.T. and Kwiatkowski, D.J. (
Niida, Y., Stemmer-Rachamimov, A.O., Logrip, M., Tapon, D., Perez, R., Kwiatkowski, D.J., Sims, K., MacCollin, M., Louis, D.N. and Ramesh, V. (
Tucker, T. and Friedman, J.M. (
Han, S., Santos, T.M., Puga, A., Roy, J., Thiele, E.A., McCollin, M., Stemmer-Rachamimov, A. and Ramesh, V. (
Chan, J.A., Zhang, H., Roberts, P.S., Jozwiak, S., Wieslawa, G., Lewin-Kowalik, J., Kotulska, K. and Kwiatkowski, D.J. (
The European Chromosome 16 Tuberous Sclerosis Consortium. (
van Slegtenhorst, M., de Hoogt, R., Hermans, C., Nellist, M., Janssen, B., Verhoef, S., Lindhout, D., van den Ouweland, A., Halley, D., Young, J. et al. (
van Slegtenhorst, M., Nellist, M., Nagelkerken, B., Cheadle, J., Snell, R., van den Ouweland, A., Reuser, A., Sampson, J., Halley, D. and van der Sluijs, P. (
Plank, T.L., Yeung, R.S. and Henske, E.P. (
Gao, X. and Pan, D. (
Potter, C.J., Huang, H. and Xu, T. (
Tapon, N., Ito, N., Dickson, B.J., Treisman, J.E. and Hariharan, I.K. (
Fingar, D.C. and Blenis, J. (
Nobukini, T. and Thomas, G. (
Pan, D., Dong, J., Zhang, Y. and Gao, X. (
Findlay, G.M., Harrington, L.S. and Lamb, R.F. (
Inoki, K., Corradetti, M.N. and Guan, K.L. (
Inoki, K., Ouyang, H., Li, Y. and Guan, K.L. (
Manning, B.D. (
Vanhaesebroeck, B. and Alessi, D.R. (
Sarbassov, D.D., Guertin, D.A., Ali, S.M. and Sabatini, D.M. (
Alessi, D.R., Deak, M., Casamayor, A., Caudwell, F.B., Morrice, N., Norman, D.G., Gaffney, P., Reese, C.B., MacDougall, C.N., Harbison, D. et al. (
Manning, B.D. and Cantley, L.C. (
Saucedo, L.J., Gao, X., Chiarelli, D.A., Li, L., Pan, D. and Edgar, B.A. (
Stocker, H., Radimerski, T., Schindelholz, B., Wittwer, F., Belawat, P., Daram, P., Breuer, S., Thomas, G. and Hafen, E. (
Zhang, Y., Gao, X., Saucedo, L.J., Ru, B., Edgar, B.A. and Pan, D. (
Garami, A., Zwartkruis, F.J., Nobukuni, T., Joaquin, M., Roccio, M., Stocker, H., Kozma, S.C., Hafen, E., Bos, J.L. and Thomas, G. (
Inoki, K., Li, Y., Xu, T. and Guan, K.L. (
Dan, H.C., Sun, M., Yang, L., Feldman, R.I., Sui, X.M., Yeung, R.S., Halley, D.J., Nicosia, S.V., Pledger, W.J. and Cheng, J.Q. (
Inoki, K., Li, Y., Zhu, T., Wu, J. and Guan, K.L. (
Manning, B.D., Tee, A.R., Logsdon, M.N., Blenis, J. and Cantley, L.C. (
Potter, C.J., Pedraza, L.G. and Xu, T. (
Im, E., von Lintig, F.C., Chen, J., Zhuang, S., Qui, W., Chowdhury, S., Worley, P.F., Boss, G.R. and Pilz, R.B. (
Tee, A.R., Manning, B.D., Roux, P.P., Cantley, L.C. and Blenis, J. (
Castro, A.F., Rebhun, J.F., Clark, G.J. and Quilliam, L.A. (
Martin, D.E. and Hall, M.N. (
Tee, A.R. and Blenis, J. (
Loewith, R., Jacinto, E., Wullschleger, S., Lorberg, A., Crespo, J.L., Bonenfant, D., Oppliger, W., Jenoe, P. and Hall, M.N. (
Hara, K., Maruki, Y., Long, X., Yoshino, K., Oshiro, N., Hidayat, S., Tokunaga, C., Avruch, J. and Yonezawa, K. (
Kim, D.H., Sarbassov dos, D., Ali, S.M., King, J.E., Latek, R.R., Erdjument-Bromage, H., Tempst, P. and Sabatini, D.M. (
Kim, D.H., Sarbassov dos, D., Ali, S.M., Latek, R.R., Guntur, K.V., Erdjument-Bromage, H., Tempst, P. and Sabatini, D.M. (
Sarbassov, D.D., Ali, S.M., Kim, D.H., Guertin, D.A., Latek, R.R., Erdjument-Bromage, H., Tempst, P. and Sabatini, D.M. (
Jacinto, E., Loewith, R., Schmidt, A., Lin, S., Ruegg, M.A., Hall, A. and Hall, M.N. (
Long, X., Lin, Y., Ortiz-Vega, S., Yonezawa, K. and Avruch, J. (
Hara, K., Yonezawa, K., Weng, Q.P., Kozlowski, M.T., Belham, C. and Avruch, J. (
Smith, E.M., Finn, S.G., Tee, A.R., Browne, G.J. and Proud, C.G. (
Richardson, C.J., Broenstrup, M., Fingar, D.C., Julich, K., Ballif, B.A., Gygi, S. and Blenis, J. (
Raught, B., Peiretti, F., Gingras, A.C., Livingstone, M., Shahbazian, D., Mayeur, G.L., Polakiewicz, R.D., Sonenberg, N. and Hershey, J.W. (
Lazaris-Karatzas, A., Montine, K.S. and Sonenberg, N. (
Wendel, H.G., De Stanchina, E., Fridman, J.S., Malina, A., Ray, S., Kogan, S., Cordon-Cardo, C., Pelletier, J. and Lowe, S.W. (
Hawley, S.A., Boudeau, J., Reid, J.L., Mustard, K.J., Udd, L., Makela, T.P., Alessi, D.R. and Hardie, D.G. (
Shaw, R.J., Kosmatka, M., Bardeesy, N., Hurley, R.L., Witters, L.A., DePinho, R.A. and Cantley, L.C. (
Woods, A., Johnstone, S.R., Dickerson, K., Leiper, F.C., Fryer, L.G., Neumann, D., Schlattner, U., Wallimann, T., Carlson, M. and Carling, D. (
Inoki, K., Zhu, T. and Guan, K.L. (
Shaw, R.J., Bardeesy, N., Manning, B.D., Lopez, L., Kosmatka, M., DePinho, R.A. and Cantley, L.C. (
Corradetti, M.N., Inoki, K., Bardeesy, N., DePinho, R.A. and Guan, K.L. (
Roux, P.P., Ballif, B.A., Anjum, R., Gygi, S.P. and Blenis, J. (
Ma, L., Chen, Z., Erdjument-Bromage, H., Tempst, P. and Pandolfi, P.P. (
Ballif, B.A., Roux, P.P., Gerber, S.A., MacKeigan, J.P., Blenis, J. and Gygi, S.P. (
Astrinidis, A., Senapedis, W., Coleman, T.R. and Henske, E.P. (
Reiling, J.H. and Hafen, E. (
Brugarolas, J., Lei, K., Hurley, R.L., Manning, B.D., Reiling, J.H., Hafen, E., Witters, L.A., Ellisen, L.W. and Kaelin, W.G., Jr. (
Zhang, H., Cicchetti, G., Onda, H., Koon, H.B., Asrican, K., Bajraszewski, N., Vazquez, F., Carpenter, C.L. and Kwiatkowski, D.J. (
Nellist, M., Sancak, O., Goedbloed, M.A., Rohe, C., van Netten, D., Mayer, K., Tucker-Williams, A., van den Ouweland, A.M. and Halley, D.J. (
El-Hashemite, N., Zhang, H., Henske, E.P. and Kwiatkowski, D.J. (
Goncharova, E.A., Goncharov, D.A., Eszterhas, A., Hunter, D.S., Glassberg, M.K., Yeung, R.S., Walker, C.L., Noonan, D., Kwiatkowski, D.J., Chou, M.M. et al. (
Jaeschke, A., Hartkamp, J., Saitoh, M., Roworth, W., Nobukuni, T., Hodges, A., Sampson, J., Thomas, G. and Lamb, R. (
Kwiatkowski, D.J., Zhang, H., Bandura, J.L., Heiberger, K.M., Glogauer, M., el-Hashemite, N. and Onda, H. (
Harrington, L.S., Findlay, G.M., Gray, A., Tolkacheva, T., Wigfield, S., Rebholz, H., Barnett, J., Leslie, N.R., Cheng, S., Shepherd, P.R. et al. (
Shah, O.J., Wang, Z. and Hunter, T. (
Manning, B.D., Logsdon, M.N., Lipovsky, A., Abbott, D., Kwiatkowski, D.J. and Cantley, L.C. (
Kenerson, H., Dundon, T.A. and Yeung, R.S. (
